- Lecture-1 Introduction to QOM — Fall PART 2 (1)

Содержание
- 2. Quality & Operations Management Lecturer: Sitora Inoyatova ([email protected]) Lecture 1: Intro Lecture 1 Introduction to Quality
- 3. Agenda Recap ”Gap” Model of Quality Quality Costs Topology of operations (Four Vs) Assignment Task
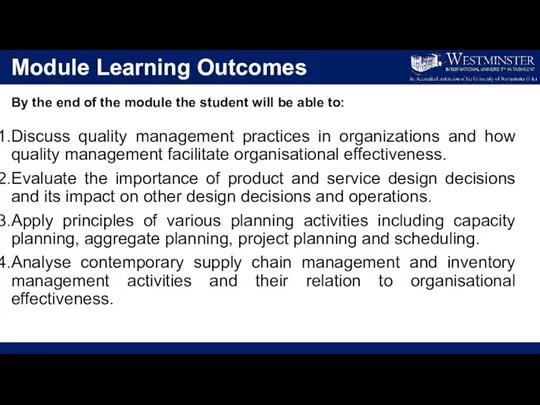
- 4. Module Learning Outcomes By the end of the module the student will be able to: Discuss
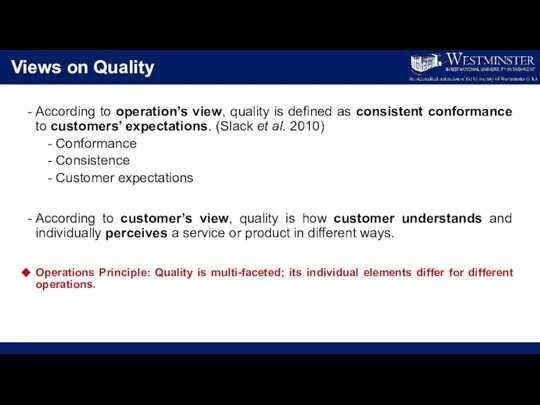
- 5. Views on Quality According to operation’s view, quality is defined as consistent conformance to customers’ expectations.
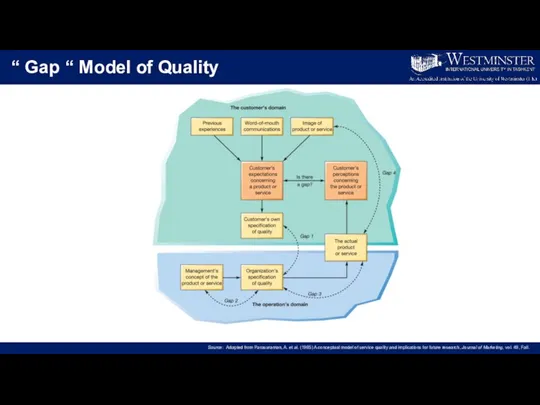
- 6. “ Gap “ Model of Quality Source: Adapted from Parasuraman, A. et al. (1985) A conceptual
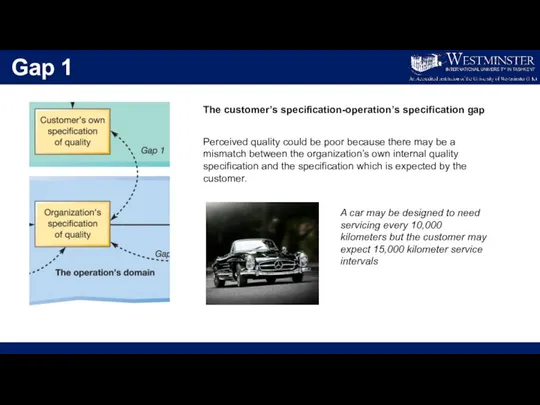
- 7. Gap 1 The customer’s specification-operation’s specification gap Perceived quality could be poor because there may be
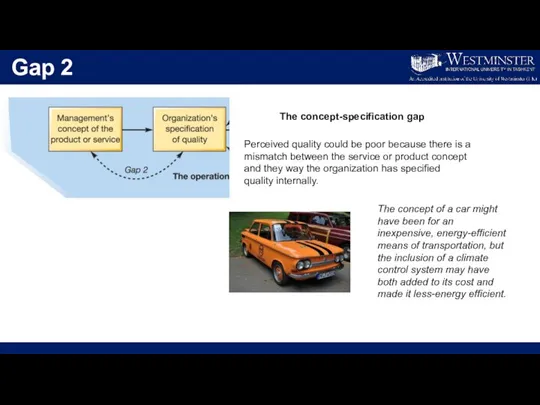
- 8. Gap 2 The concept-specification gap Perceived quality could be poor because there is a mismatch between
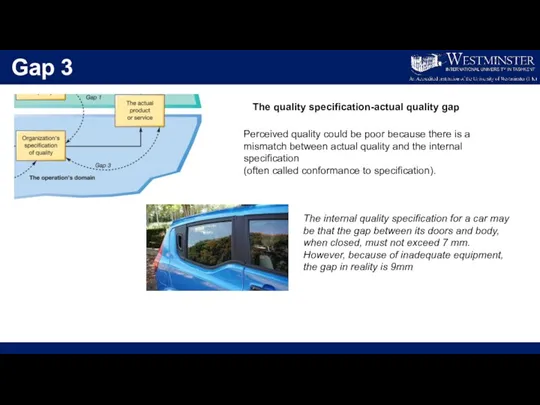
- 9. Gap 3 The quality specification-actual quality gap Perceived quality could be poor because there is a
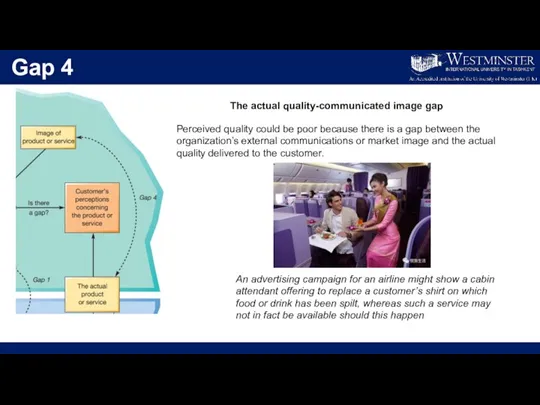
- 10. Gap 4 The actual quality-communicated image gap Perceived quality could be poor because there is a
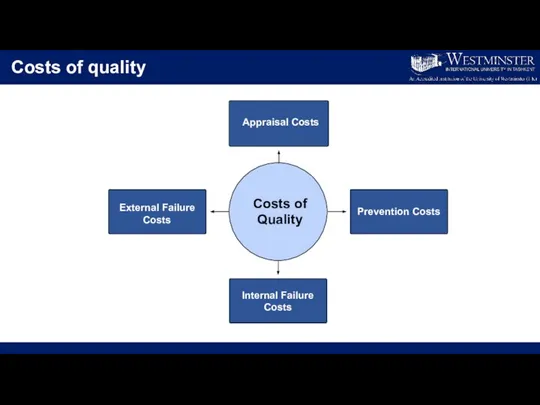
- 11. Costs of quality
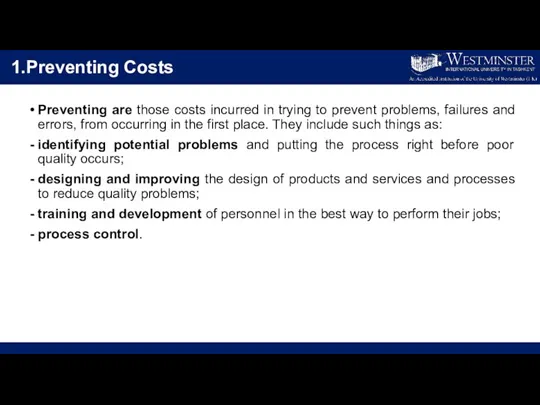
- 12. 1.Preventing Costs Preventing are those costs incurred in trying to prevent problems, failures and errors, from
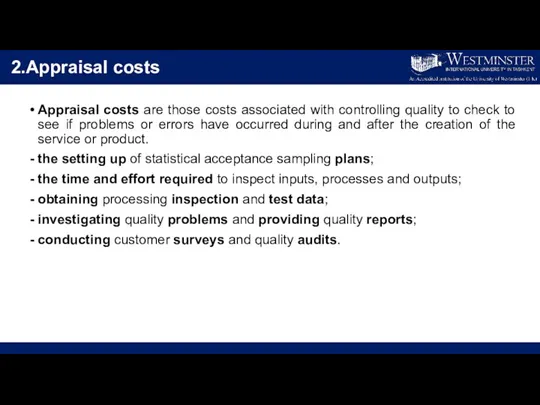
- 13. 2.Appraisal costs Appraisal costs are those costs associated with controlling quality to check to see if
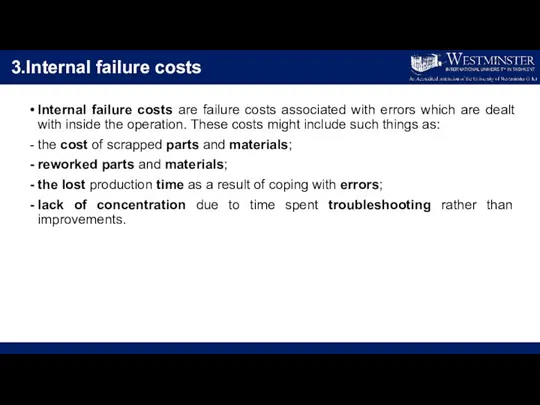
- 14. 3.Internal failure costs Internal failure costs are failure costs associated with errors which are dealt with
- 15. 4.External failure costs External failure costs are those which are associated with an error going out
- 16. The Four Vs
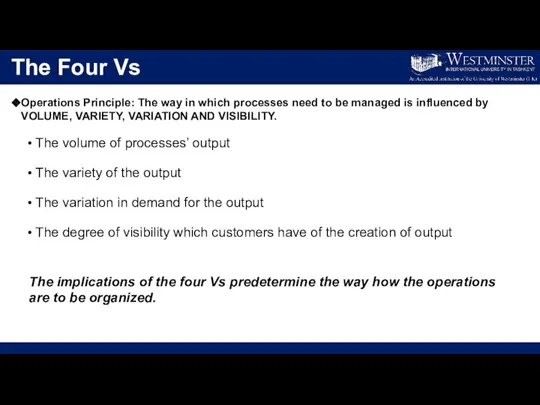
- 17. The Four Vs The volume of processes’ output The variety of the output The variation in
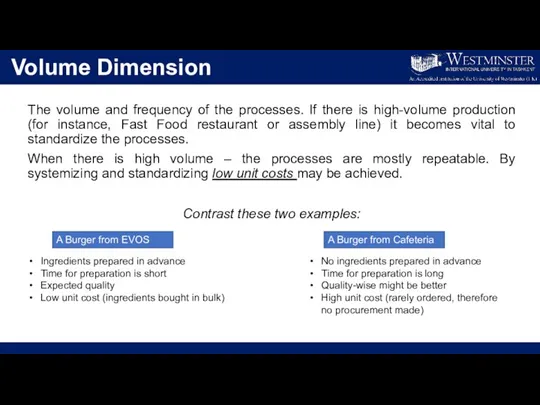
- 18. Volume Dimension The volume and frequency of the processes. If there is high-volume production (for instance,
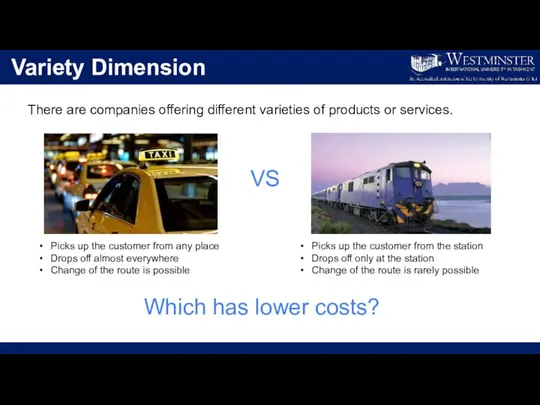
- 19. Variety Dimension There are companies offering different varieties of products or services. VS Picks up the
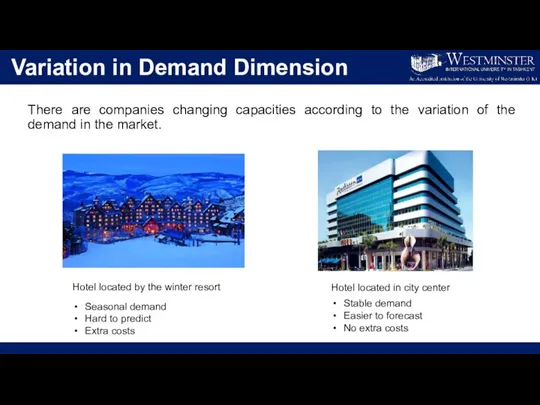
- 20. Variation in Demand Dimension There are companies changing capacities according to the variation of the demand
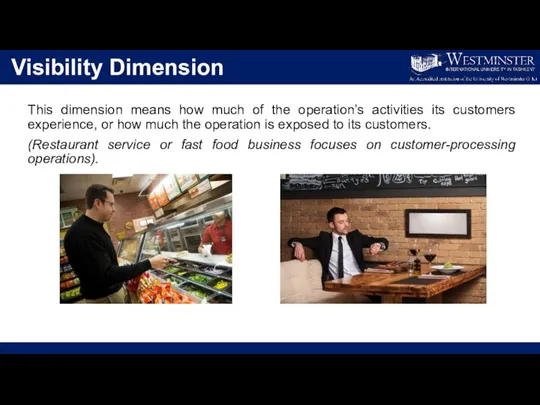
- 21. Visibility Dimension This dimension means how much of the operation’s activities its customers experience, or how
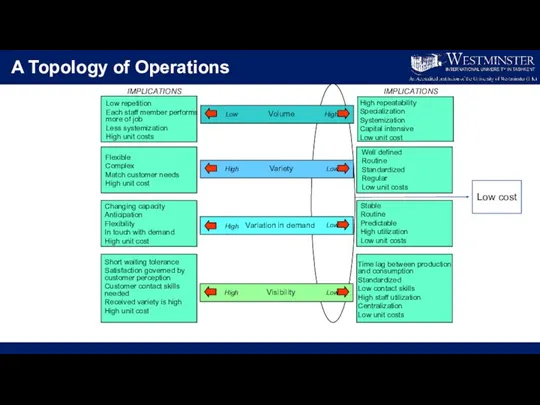
- 22. A Topology of Operations IMPLICATIONS IMPLICATIONS High Low Visibility High Low Variation in demand High Low
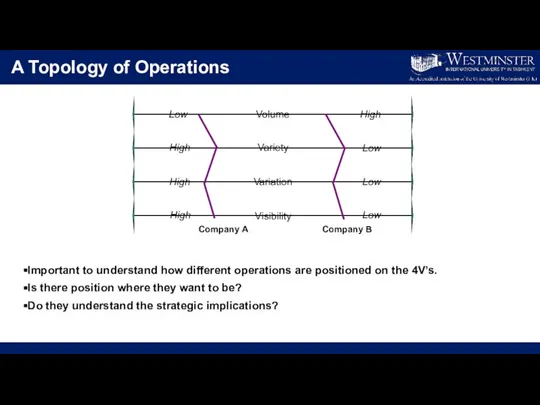
- 23. A Topology of Operations Important to understand how different operations are positioned on the 4V’s. Is
- 24. Subway Example
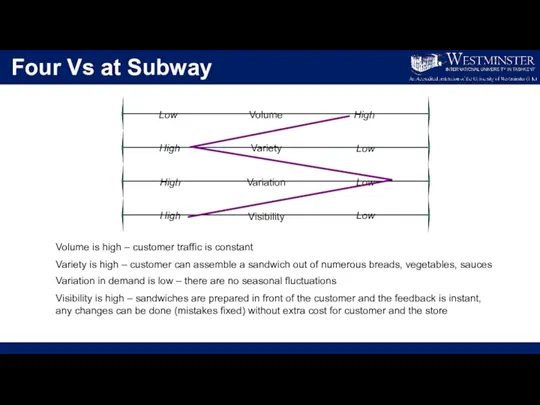
- 25. Four Vs at Subway Volume Variety Variation Visibility Low High High High High Low Low Low
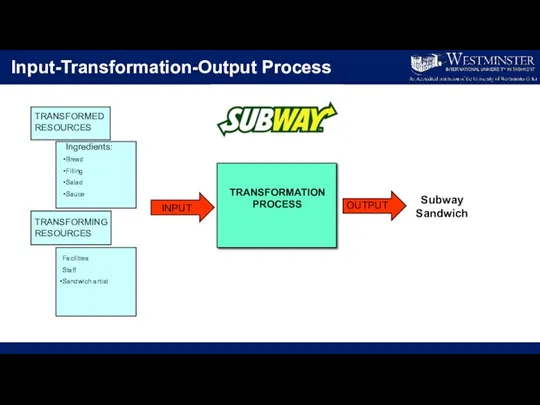
- 26. Input-Transformation-Output Process INPUT Subway Sandwich TRANSFORMATION PROCESS OUTPUT
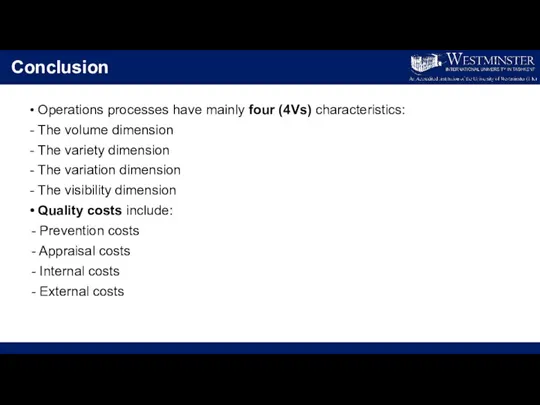
- 27. Conclusion Operations processes have mainly four (4Vs) characteristics: The volume dimension The variety dimension The variation
- 29. Скачать презентацию
Слайд 2Quality & Operations Management
Lecturer: Sitora Inoyatova ([email protected]) Lecture 1: Intro
Lecture 1
Introduction
Quality & Operations Management
Lecturer: Sitora Inoyatova ([email protected]) Lecture 1: Intro
Lecture 1
Introduction
Слайд 3Agenda
Recap
”Gap” Model of Quality
Quality Costs
Topology of operations (Four Vs)
Assignment
Agenda
Recap
”Gap” Model of Quality
Quality Costs
Topology of operations (Four Vs)
Assignment
Слайд 4Module Learning Outcomes
By the end of the module the student will be
Module Learning Outcomes
By the end of the module the student will be
Слайд 5Views on Quality
According to operation’s view, quality is defined as consistent conformance
Views on Quality
According to operation’s view, quality is defined as consistent conformance
Слайд 6“ Gap “ Model of Quality
Source: Adapted from Parasuraman, A. et al.
“ Gap “ Model of Quality
Source: Adapted from Parasuraman, A. et al.
Слайд 7Gap 1
The customer’s specification-operation’s specification gap
Perceived quality could be poor because there
Gap 1
The customer’s specification-operation’s specification gap
Perceived quality could be poor because there
Слайд 8Gap 2
The concept-specification gap
Perceived quality could be poor because there is a
Gap 2
The concept-specification gap
Perceived quality could be poor because there is a
Слайд 9Gap 3
The quality specification-actual quality gap
Perceived quality could be poor because
Gap 3
The quality specification-actual quality gap
Perceived quality could be poor because
Слайд 10Gap 4
The actual quality-communicated image gap
Perceived quality could be poor because
Gap 4
The actual quality-communicated image gap
Perceived quality could be poor because
Слайд 11Costs of quality
Costs of quality
Слайд 121.Preventing Costs
Preventing are those costs incurred in trying to prevent problems, failures
1.Preventing Costs
Preventing are those costs incurred in trying to prevent problems, failures
Слайд 132.Appraisal costs
Appraisal costs are those costs associated with controlling quality to check
2.Appraisal costs
Appraisal costs are those costs associated with controlling quality to check
Слайд 143.Internal failure costs
Internal failure costs are failure costs associated with errors which
3.Internal failure costs
Internal failure costs are failure costs associated with errors which
Слайд 154.External failure costs
External failure costs are those which are associated with an
4.External failure costs
External failure costs are those which are associated with an

Слайд 16The Four Vs
The Four Vs

Слайд 17The Four Vs
The volume of processes’ output
The variety of the output
The variation
The Four Vs
The volume of processes’ output
The variety of the output
The variation
Слайд 18Volume Dimension
The volume and frequency of the processes. If there is high-volume
Volume Dimension
The volume and frequency of the processes. If there is high-volume
Слайд 19Variety Dimension
There are companies offering different varieties of products or services.
VS
Picks up
Variety Dimension
There are companies offering different varieties of products or services.
VS
Picks up
Слайд 20Variation in Demand Dimension
There are companies changing capacities according to the variation
Variation in Demand Dimension
There are companies changing capacities according to the variation
Слайд 21Visibility Dimension
This dimension means how much of the operation’s activities its customers
Visibility Dimension
This dimension means how much of the operation’s activities its customers
Слайд 22A Topology of Operations
IMPLICATIONS
IMPLICATIONS
High
Low
Visibility
High
Low
Variation in demand
High
Low
Variety
Low
High
Volume
Changing capacity
Anticipation
Flexibility
In touch with demand
High unit cost
Flexible
Complex
Match
A Topology of Operations
IMPLICATIONS
IMPLICATIONS
High
Low
Visibility
High
Low
Variation in demand
High
Low
Variety
Low
High
Volume
Changing capacity
Anticipation
Flexibility
In touch with demand
High unit cost
Flexible
Complex
Match
Слайд 23A Topology of Operations
Important to understand how different operations are positioned on
A Topology of Operations
Important to understand how different operations are positioned on
Слайд 24Subway Example
Subway Example
Слайд 25Four Vs at Subway
Volume
Variety
Variation
Visibility
Low
High
High
High
High
Low
Low
Low
Volume is high – customer traffic is constant
Variety
Four Vs at Subway
Volume
Variety
Variation
Visibility
Low
High
High
High
High
Low
Low
Low
Volume is high – customer traffic is constant
Variety
Слайд 26Input-Transformation-Output Process
INPUT
Subway Sandwich
TRANSFORMATION PROCESS
OUTPUT
Input-Transformation-Output Process
INPUT
Subway Sandwich
TRANSFORMATION PROCESS
OUTPUT
Слайд 27Conclusion
Operations processes have mainly four (4Vs) characteristics:
The volume dimension
The variety
Conclusion
Operations processes have mainly four (4Vs) characteristics:
The volume dimension
The variety
 Организация хранения и использования фотодокументов в туранском филиале национального музея им. Алдан-маадыр
 Спряжение глагола. Лицо и число
 Пищеварительная система
  Химия и проблемы охраны окружающей среды.
 Плоды. Распространение плодов и семян
 ВД_ 7 класс Решение нестандартных задач по физике
 Автоматизация бизнес-процессов стоматологической клиники
 mnozhestvo_i_ego_elementy
 Каталог новогодних сувениров
 День коренных народов мира
 Время перемен. Центр женской гармонии Апсара
 Множественное число The nouns
 Регламентированный и управленческий учет затрат в ERP-системе 1С:Управление предприятием
 Глагол to have got
 О КОМПАНИИ ЗАО РК «Связьтранзит» - стабильная, динамично развивающаяся компания. Мы разрабатываем и реализуем проекты строительст
 Основные приёмы работы с текстом при подготовке написания сжатого изложения
 ПРЕДВАРИТЕЛЬНАЯ ПРОГРАММА ПАРИЖСКОГО МОДУЛЯ «МОСКВА – ПАРИЖ» EXECUTIVE MBA LWB ГУУ – ESCP-EAP
 Франция
 Сталь 9 класс
 История религий
 Презентация на тему Здоровьесберегающие технологии в ДОУ
 Ancient Cities in Europe and Their Historical Heritage as Economic and Political Resource
 ТЕХНИЧЕСКИЙ ОСМОТР ТРАНСПОРТНЫХ СРЕДСТВ
 Разработка датчиков постоянного тока микропроцессорных расцепителей
 Природа форм и видов денег
 Эффективная интеграция – основа роста оператора связи. НАЗВАНИЕ: Конвергентная биллинговая платформа Phonekeeper 6.0 Цель данного
 Пакетные предложения
 Подготовка к запланированному внутреннему аудиту