- Macroeconomics 5

Содержание
- 2. What are business cycles? Perhaps, you know something from the introductory level… The business cycles occur
- 3. Phases of business cycles In other words, Business Cycles are alternating periods of economic expansion and
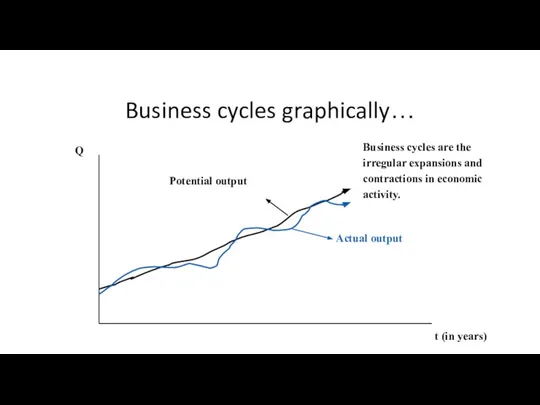
- 4. Business cycles graphically… Potential output Actual output Business cycles are the irregular expansions and contractions in
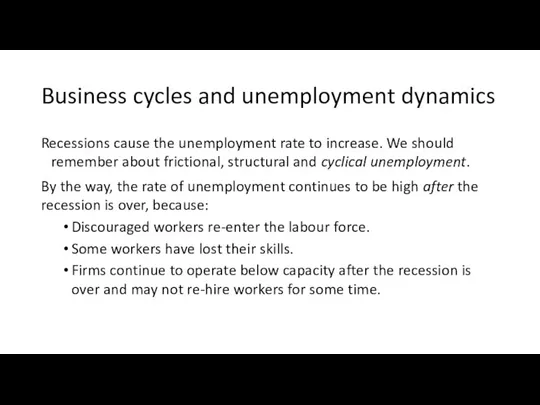
- 5. Business cycles and unemployment dynamics Recessions cause the unemployment rate to increase. We should remember about
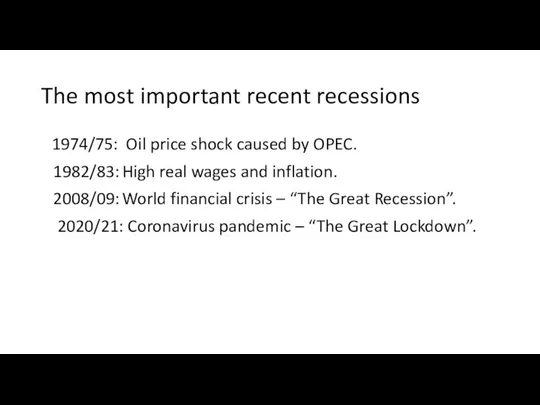
- 6. The most important recent recessions 1974/75: Oil price shock caused by OPEC. 1982/83: High real wages
- 7. How to explain business cycles? ?
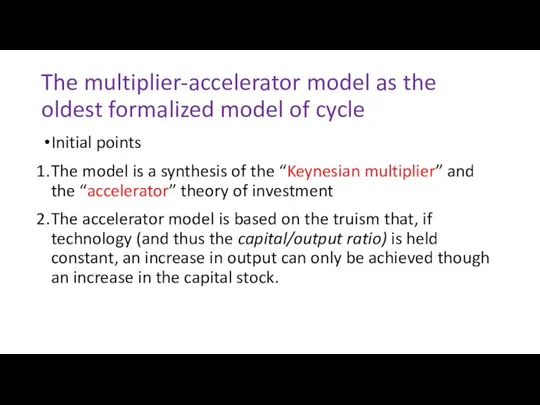
- 8. The multiplier-accelerator model as the oldest formalized model of cycle Initial points The model is a
- 9. What is the accelerator? Firms need a given quantity of capital to produce the current level
- 10. About constancy of the capital-output ratio If we do not allow for productivity boosting technical change,
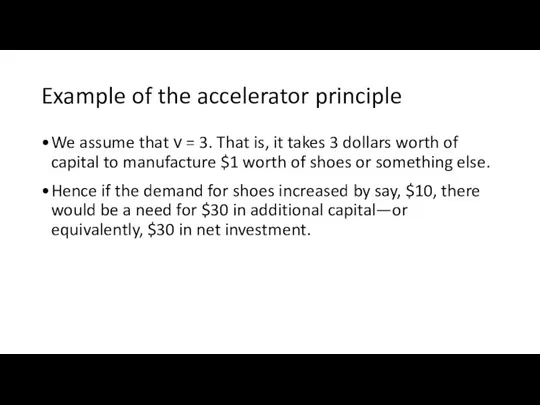
- 11. Example of the accelerator principle We assume that ν = 3. That is, it takes 3
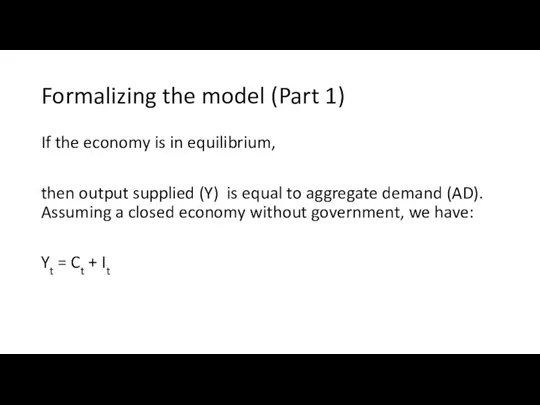
- 12. Formalizing the model (Part 1) If the economy is in equilibrium, then output supplied (Y) is
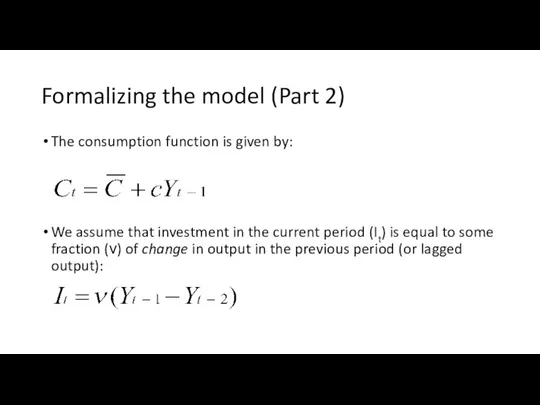
- 13. Formalizing the model (Part 2) The consumption function is given by: We assume that investment in
- 14. Combining these equations, we will receive: To simplify, we ignore the constant To get a standardized
- 15. Some essential ideas Change in investment affects output/income. Change in output/income affects (with delay) investment. Higher
- 16. Some conclusions (derived from the fundamental mathematical principles) There will be cyclical fluctuations in the time
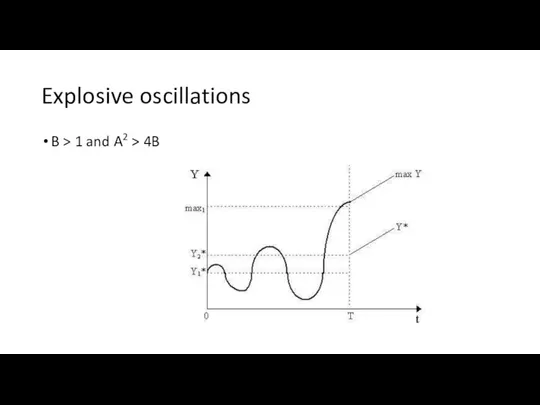
- 17. Explosive oscillations B > 1 and A2 > 4B
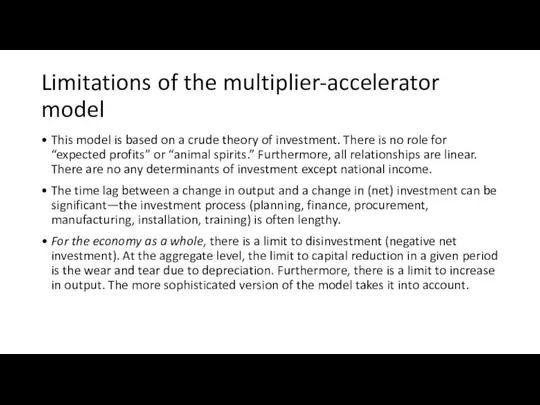
- 18. Limitations of the multiplier-accelerator model This model is based on a crude theory of investment. There
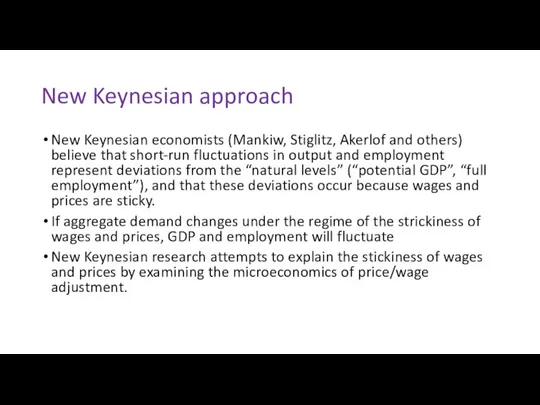
- 19. New Keynesian approach New Keynesian economists (Mankiw, Stiglitz, Akerlof and others) believe that short-run fluctuations in
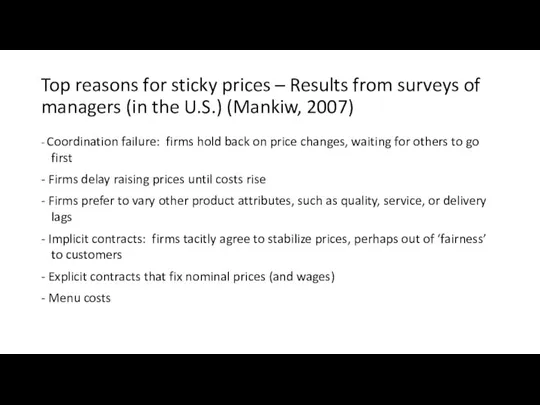
- 20. Top reasons for sticky prices – Results from surveys of managers (in the U.S.) (Mankiw, 2007)
- 21. The Real Business Cycle model All prices are flexible, even in short run: thus, money is
- 22. Intertemporal substitution of labor In the RBC model, workers are willing to reallocate labor over time
- 23. The mechanism of cycles in the RBC model In the RBC model, productivity shocks cause fluctuations
- 24. Are prices/wages flexible? The RBC model assumes that wages and prices are completely flexible, so markets
- 25. The financial fragility hypothesis (aka the financial instability hypothesis) Financial fragility hypothesis – developed by Hyman
- 26. The classification of borrowers (and regimes of financing) Minsky identified three types of borrowers that contribute
- 27. Reasons for the name “Ponzi finance” or “Ponzi regime” Named after Charles Ponzi (1882-1949), an Italian
- 28. The theory of firm’s investment decision graphically
- 29. Some explanations I is investment PK is the demand price of investment (willingness to pay some
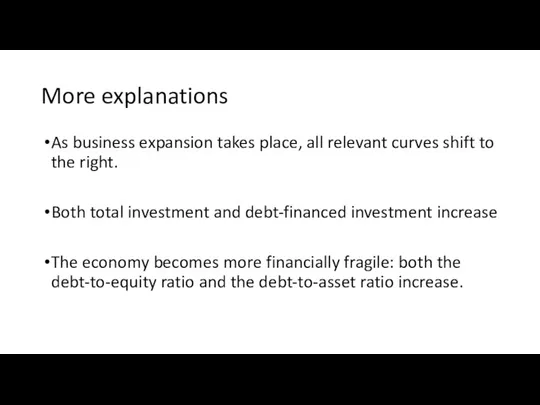
- 30. More explanations As business expansion takes place, all relevant curves shift to the right. Both total
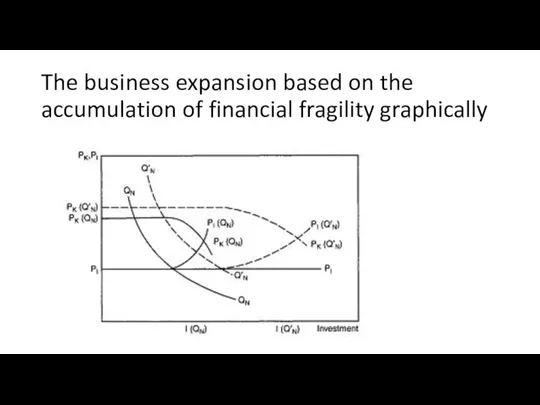
- 31. The business expansion based on the accumulation of financial fragility graphically
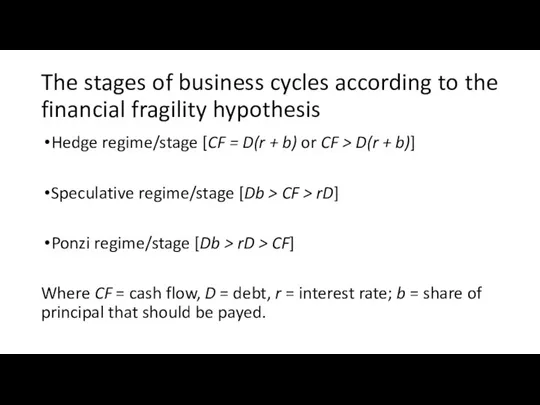
- 32. The stages of business cycles according to the financial fragility hypothesis Hedge regime/stage [CF = D(r
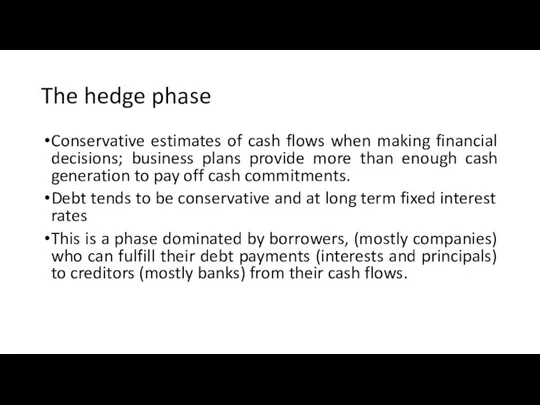
- 33. The hedge phase Conservative estimates of cash flows when making financial decisions; business plans provide more
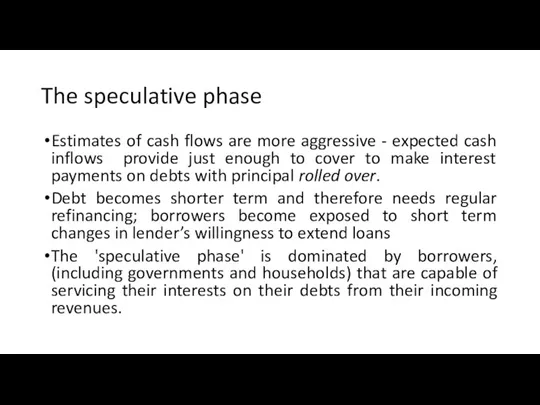
- 34. The speculative phase Estimates of cash flows are more aggressive - expected cash inflows provide just
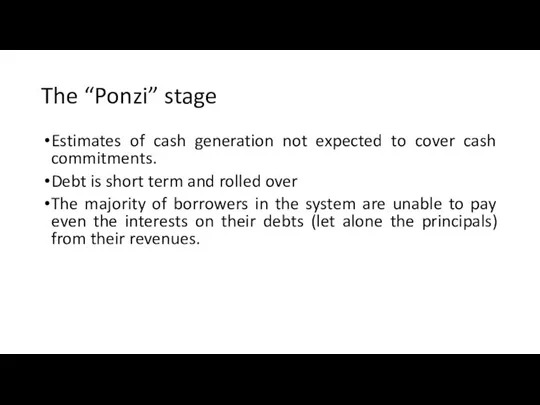
- 35. The “Ponzi” stage Estimates of cash generation not expected to cover cash commitments. Debt is short
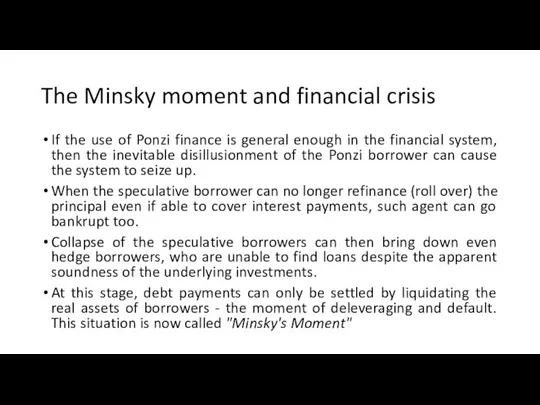
- 36. The Minsky moment and financial crisis If the use of Ponzi finance is general enough in
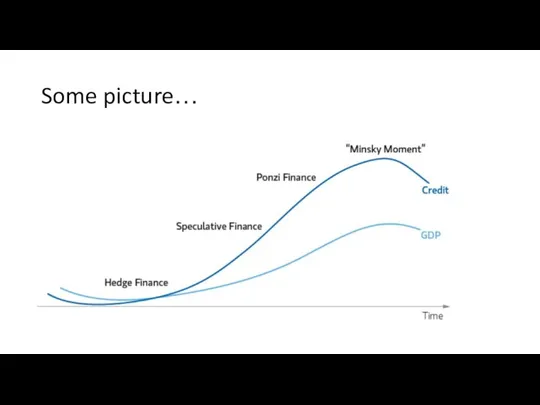
- 37. Some picture…
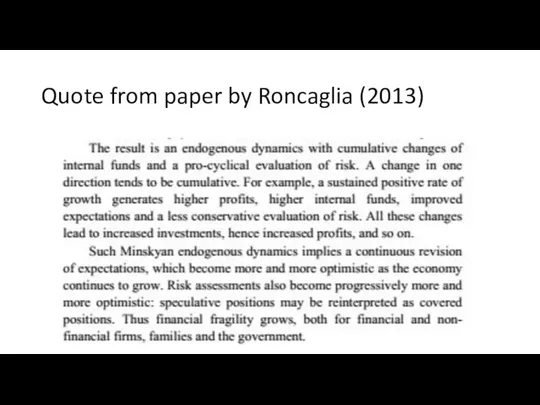
- 38. Quote from paper by Roncaglia (2013)
- 39. Minsky about the policy Minsky observes that the government intervention (proper fiscal policy measures) are necessary
- 40. More about the “proper” fiscal policy Fiscal policy may have a discretionary component, such as the
- 41. The fiscal policy may not be enough Governments alone may not be enough to stabilize the
- 42. Paradox of tranquility Government intervention is needed to stabilize the economy... If policies are successful, the
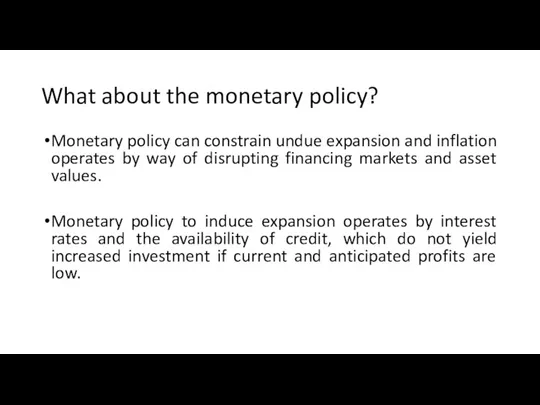
- 43. What about the monetary policy? Monetary policy can constrain undue expansion and inflation operates by way
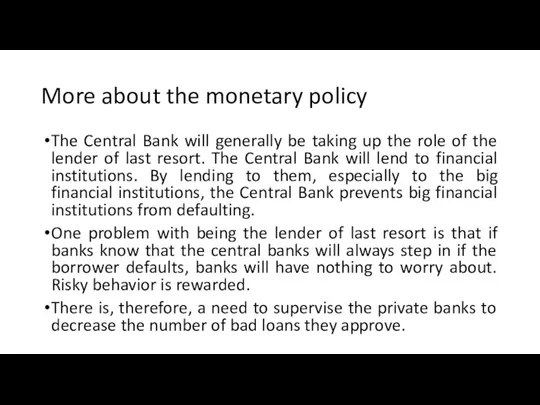
- 44. More about the monetary policy The Central Bank will generally be taking up the role of
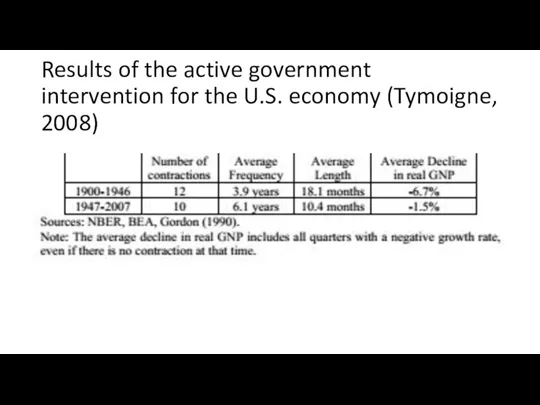
- 45. Results of the active government intervention for the U.S. economy (Tymoigne, 2008)
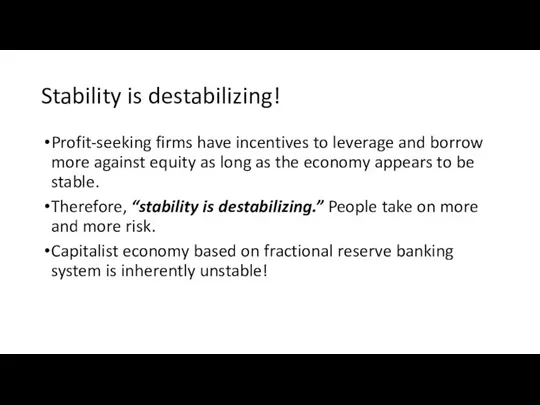
- 46. Stability is destabilizing! Profit-seeking firms have incentives to leverage and borrow more against equity as long
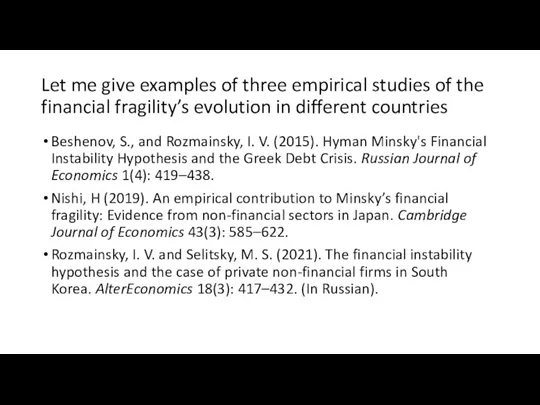
- 47. Let me give examples of three empirical studies of the financial fragility’s evolution in different countries
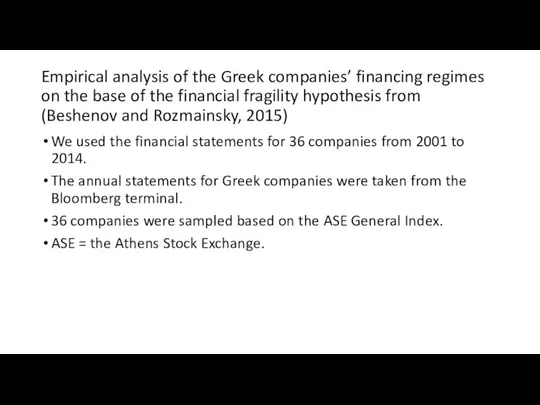
- 48. Empirical analysis of the Greek companies’ financing regimes on the base of the financial fragility hypothesis
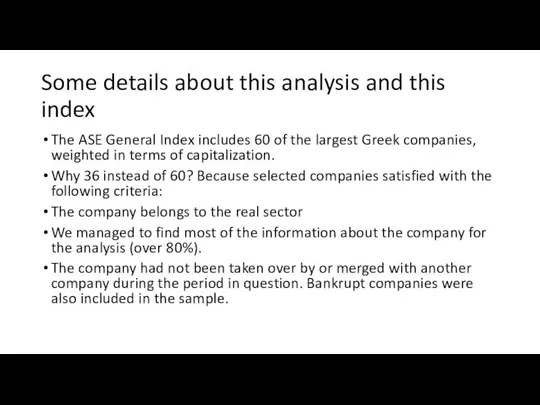
- 49. Some details about this analysis and this index The ASE General Index includes 60 of the
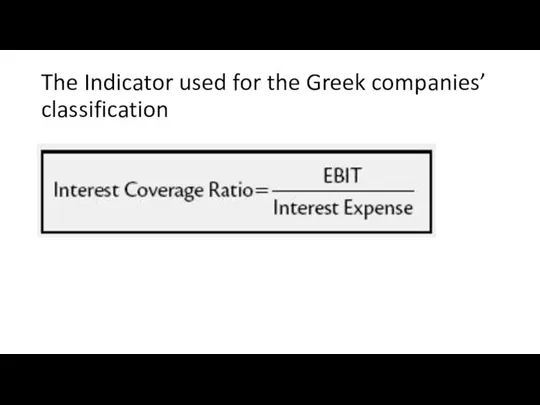
- 50. The Indicator used for the Greek companies’ classification
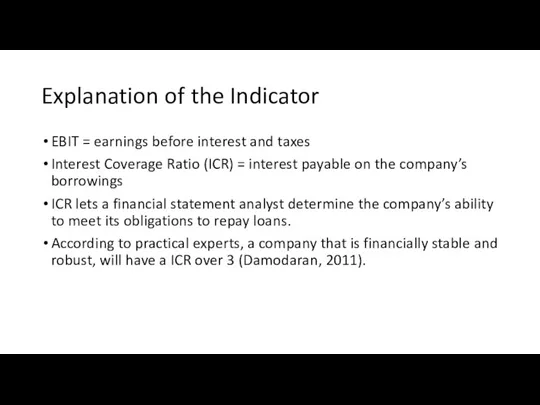
- 51. Explanation of the Indicator EBIT = earnings before interest and taxes Interest Coverage Ratio (ICR) =
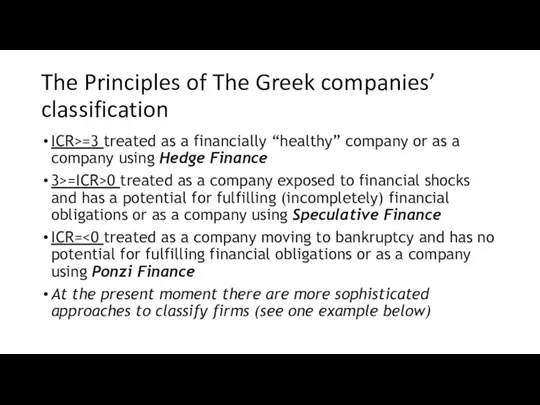
- 52. The Principles of The Greek companies’ classification ICR>=3 treated as a financially “healthy” company or as
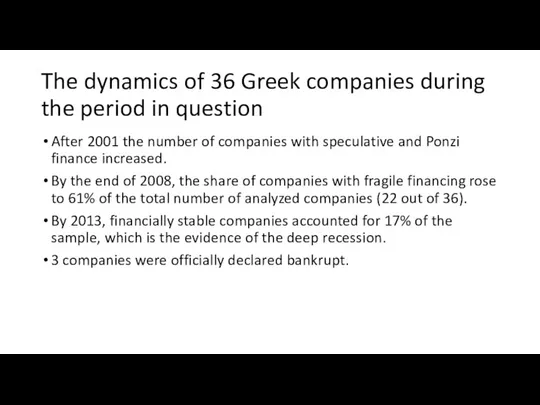
- 53. The dynamics of 36 Greek companies during the period in question After 2001 the number of
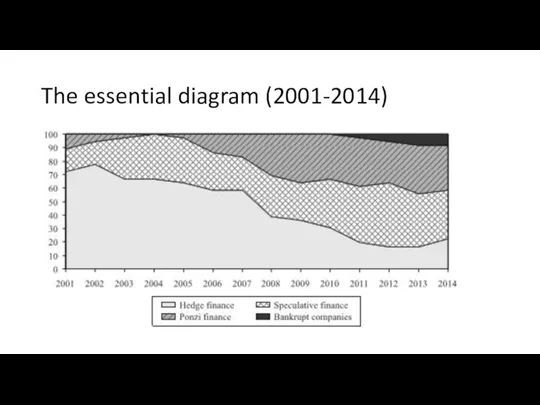
- 54. The essential diagram (2001-2014)
- 55. Some Conclusions Experience of the Greek economy is consistent with the FIH. In the 2000s, the
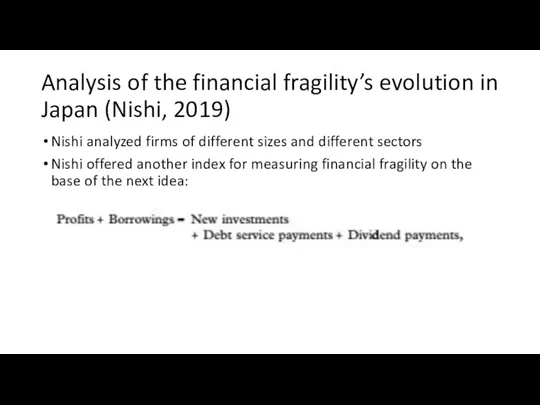
- 56. Analysis of the financial fragility’s evolution in Japan (Nishi, 2019) Nishi analyzed firms of different sizes
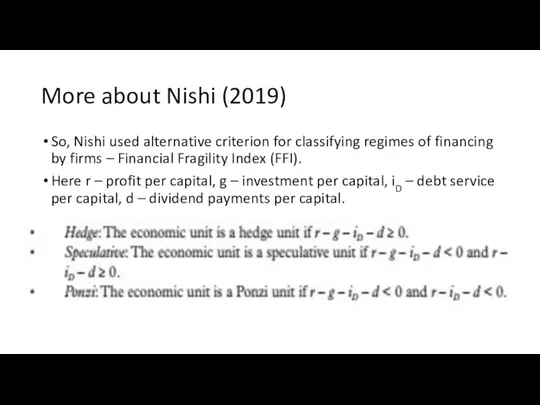
- 57. More about Nishi (2019) So, Nishi used alternative criterion for classifying regimes of financing by firms
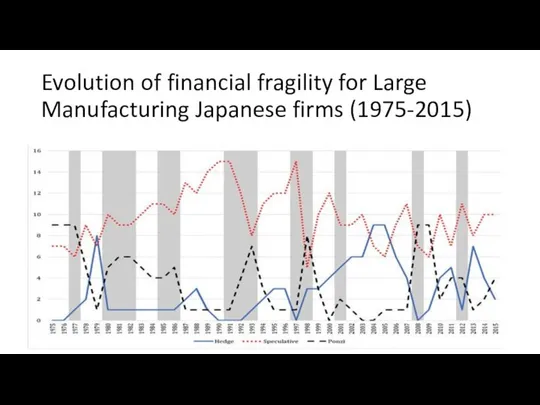
- 58. Evolution of financial fragility for Large Manufacturing Japanese firms (1975-2015)
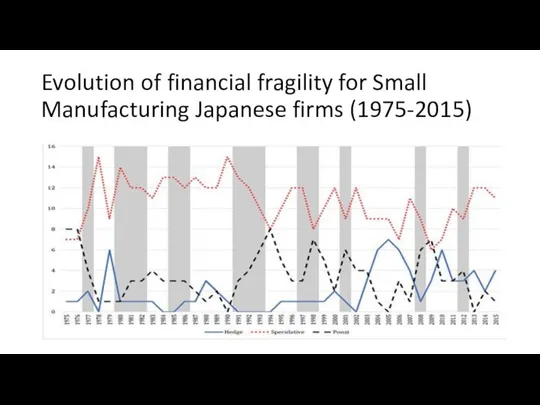
- 59. Evolution of financial fragility for Small Manufacturing Japanese firms (1975-2015)
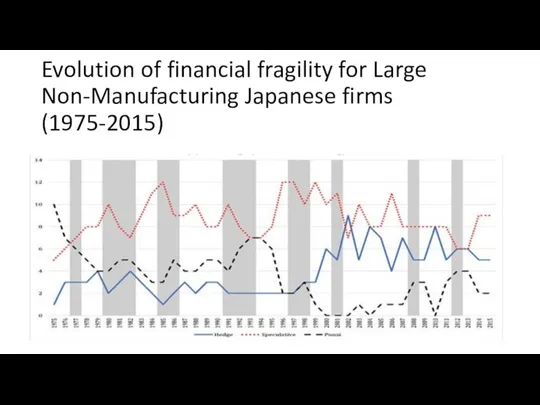
- 60. Evolution of financial fragility for Large Non-Manufacturing Japanese firms (1975-2015)
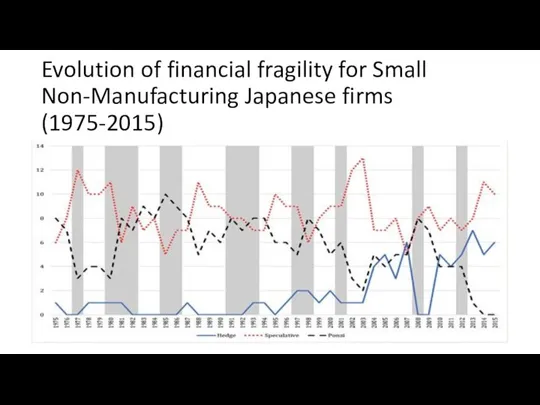
- 61. Evolution of financial fragility for Small Non-Manufacturing Japanese firms (1975-2015)
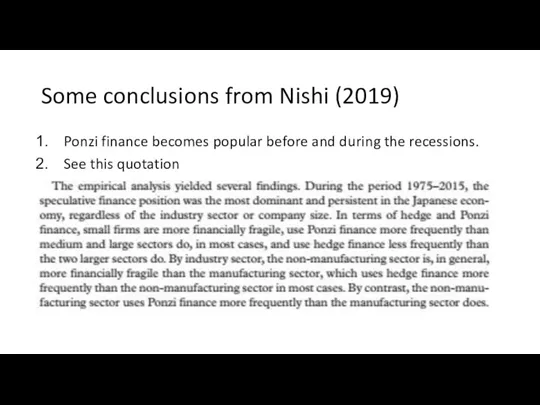
- 62. Some conclusions from Nishi (2019) Ponzi finance becomes popular before and during the recessions. See this
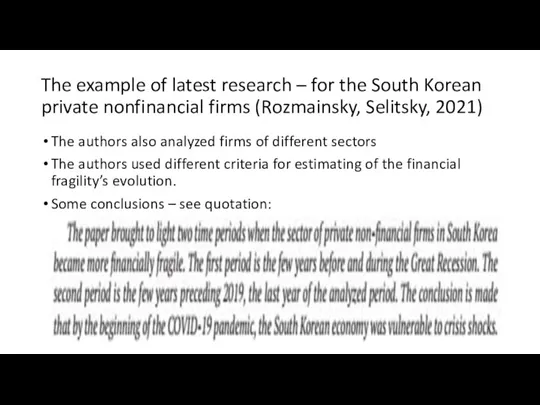
- 63. The example of latest research – for the South Korean private nonfinancial firms (Rozmainsky, Selitsky, 2021)
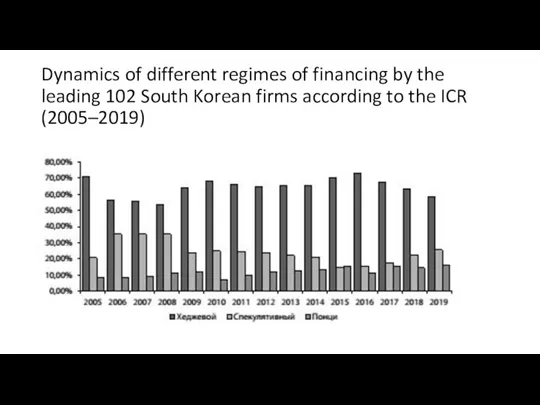
- 64. Dynamics of different regimes of financing by the leading 102 South Korean firms according to the
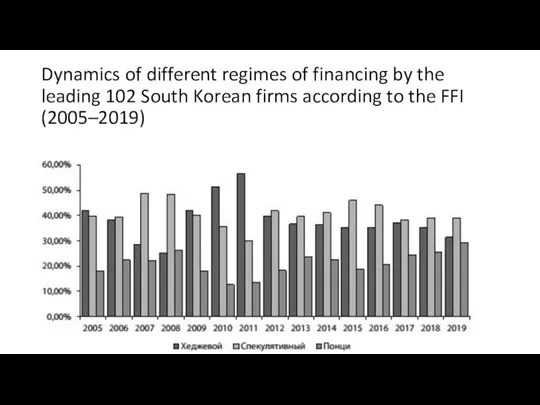
- 65. Dynamics of different regimes of financing by the leading 102 South Korean firms according to the
- 67. Скачать презентацию
Слайд 3Phases of business cycles
In other words, Business Cycles are alternating periods of
Phases of business cycles
In other words, Business Cycles are alternating periods of
Слайд 4Business cycles graphically…
Potential output
Actual output
Business cycles are the
irregular expansions and
contractions in economic
Business cycles graphically…
Potential output
Actual output
Business cycles are the
irregular expansions and
contractions in economic
Слайд 5Business cycles and unemployment dynamics
Recessions cause the unemployment rate to increase. We
Business cycles and unemployment dynamics
Recessions cause the unemployment rate to increase. We
Слайд 6The most important recent recessions
1974/75: Oil price shock caused by OPEC.
The most important recent recessions
1974/75: Oil price shock caused by OPEC.
Слайд 7How to explain business cycles?
?
How to explain business cycles?
?
Слайд 8The multiplier-accelerator model as the oldest formalized model of cycle
Initial points
The model
The multiplier-accelerator model as the oldest formalized model of cycle
Initial points
The model
Слайд 9What is the accelerator?
Firms need a given quantity of capital to produce
What is the accelerator?
Firms need a given quantity of capital to produce

Слайд 10About constancy of the capital-output ratio
If we do not allow for productivity
About constancy of the capital-output ratio
If we do not allow for productivity
Слайд 11Example of the accelerator principle
We assume that ν = 3. That is,
Example of the accelerator principle
We assume that ν = 3. That is,
Слайд 12Formalizing the model (Part 1)
If the economy is in equilibrium,
then output
Formalizing the model (Part 1)
If the economy is in equilibrium,
then output
Слайд 13Formalizing the model (Part 2)
The consumption function is given by:
We assume that
Formalizing the model (Part 2)
The consumption function is given by:
We assume that
Слайд 14Combining these equations, we will receive:
To simplify, we ignore the constant
To
Combining these equations, we will receive:
To simplify, we ignore the constant
To

Слайд 15Some essential ideas
Change in investment affects output/income.
Change in output/income affects (with delay)
Some essential ideas
Change in investment affects output/income.
Change in output/income affects (with delay)
Слайд 16Some conclusions (derived from the fundamental mathematical principles)
There will be cyclical fluctuations
Some conclusions (derived from the fundamental mathematical principles)
There will be cyclical fluctuations

Слайд 17Explosive oscillations
B > 1 and A2 > 4B
Explosive oscillations
B > 1 and A2 > 4B
Слайд 18Limitations of the multiplier-accelerator model
This model is based on a crude theory
Limitations of the multiplier-accelerator model
This model is based on a crude theory
Слайд 19New Keynesian approach
New Keynesian economists (Mankiw, Stiglitz, Akerlof and others) believe that
New Keynesian approach
New Keynesian economists (Mankiw, Stiglitz, Akerlof and others) believe that
Слайд 20Top reasons for sticky prices – Results from surveys of managers (in
Top reasons for sticky prices – Results from surveys of managers (in
Слайд 21The Real Business Cycle model
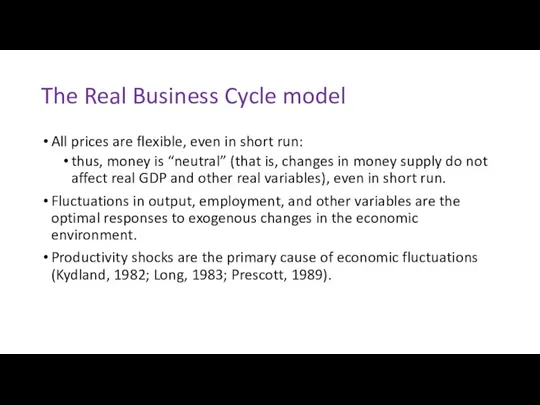
All prices are flexible, even in short run:
thus,
The Real Business Cycle model
All prices are flexible, even in short run:
thus,
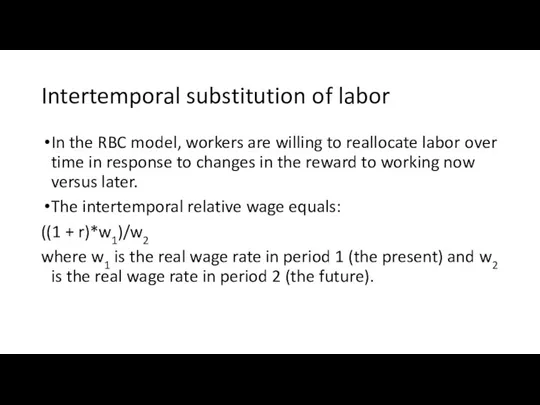
Слайд 22Intertemporal substitution of labor
In the RBC model, workers are willing to
Intertemporal substitution of labor
In the RBC model, workers are willing to
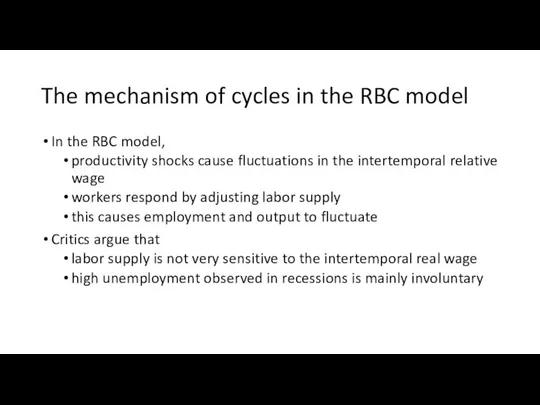
Слайд 23The mechanism of cycles in the RBC model
In the RBC model,
productivity
The mechanism of cycles in the RBC model
In the RBC model,
productivity
Слайд 24Are prices/wages flexible?
The RBC model assumes that wages and prices are completely
Are prices/wages flexible?
The RBC model assumes that wages and prices are completely

Слайд 25The financial fragility hypothesis (aka the financial instability hypothesis)
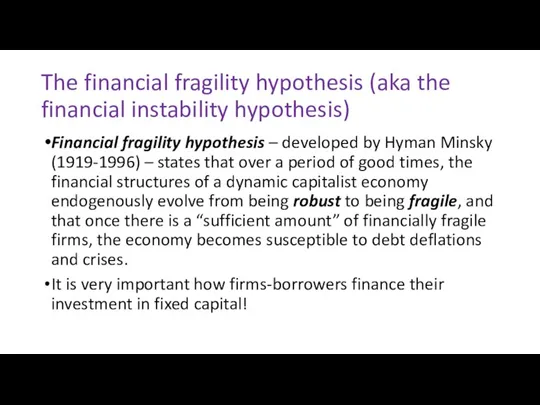
Financial fragility hypothesis –
The financial fragility hypothesis (aka the financial instability hypothesis)
Financial fragility hypothesis –
Слайд 26The classification of borrowers (and regimes of financing)
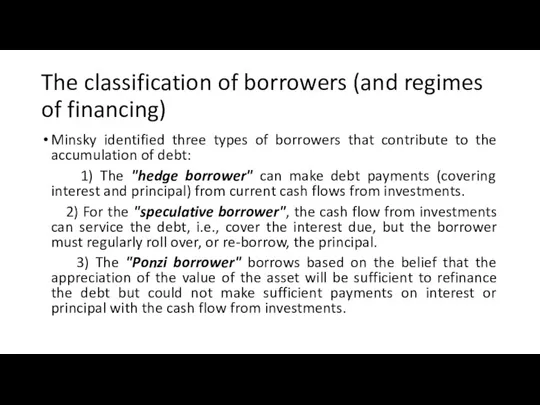
Minsky identified three types of
The classification of borrowers (and regimes of financing)
Minsky identified three types of
Слайд 27Reasons for the name “Ponzi finance” or “Ponzi regime”
Named after Charles Ponzi
Reasons for the name “Ponzi finance” or “Ponzi regime”
Named after Charles Ponzi
Слайд 28The theory of firm’s investment decision graphically
The theory of firm’s investment decision graphically
Слайд 29Some explanations
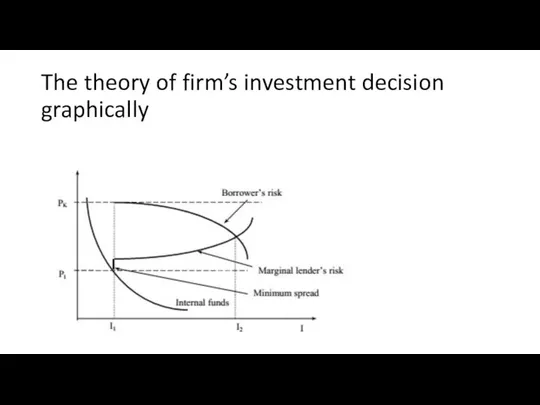
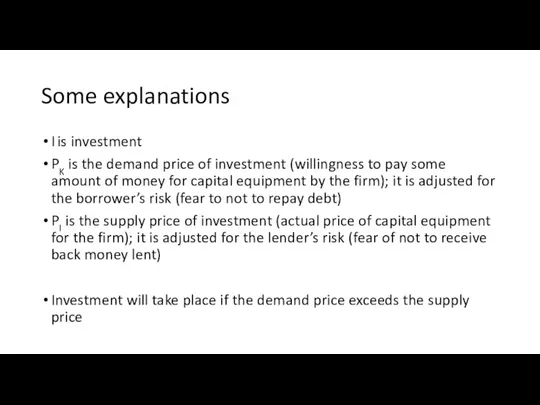
I is investment
PK is the demand price of investment (willingness
Some explanations
I is investment
PK is the demand price of investment (willingness
Слайд 30More explanations
As business expansion takes place, all relevant curves shift to the
More explanations
As business expansion takes place, all relevant curves shift to the
Слайд 31The business expansion based on the accumulation of financial fragility graphically
The business expansion based on the accumulation of financial fragility graphically
Слайд 32The stages of business cycles according to the financial fragility hypothesis
Hedge regime/stage
The stages of business cycles according to the financial fragility hypothesis
Hedge regime/stage
Слайд 33The hedge phase
Conservative estimates of cash flows when making financial decisions; business
The hedge phase
Conservative estimates of cash flows when making financial decisions; business
Слайд 34The speculative phase
Estimates of cash flows are more aggressive - expected cash
The speculative phase
Estimates of cash flows are more aggressive - expected cash
Слайд 35The “Ponzi” stage
Estimates of cash generation not expected to cover cash commitments.
The “Ponzi” stage
Estimates of cash generation not expected to cover cash commitments.
Слайд 36The Minsky moment and financial crisis
If the use of Ponzi finance is
The Minsky moment and financial crisis
If the use of Ponzi finance is
Слайд 37Some picture…
Some picture…
Слайд 38Quote from paper by Roncaglia (2013)
Quote from paper by Roncaglia (2013)
Слайд 39Minsky about the policy
Minsky observes that the government intervention (proper fiscal policy
Minsky about the policy
Minsky observes that the government intervention (proper fiscal policy
Слайд 40More about the “proper” fiscal policy
Fiscal policy may have a discretionary component,
More about the “proper” fiscal policy
Fiscal policy may have a discretionary component,

Слайд 41The fiscal policy may not be enough
Governments alone may not be enough
The fiscal policy may not be enough
Governments alone may not be enough
Слайд 42Paradox of tranquility
Government intervention is needed to stabilize the economy...
Paradox of tranquility
Government intervention is needed to stabilize the economy...
Слайд 43What about the monetary policy?
Monetary policy can constrain undue expansion and inflation
What about the monetary policy?
Monetary policy can constrain undue expansion and inflation
Слайд 44More about the monetary policy
The Central Bank will generally be taking up
More about the monetary policy
The Central Bank will generally be taking up
Слайд 45Results of the active government intervention for the U.S. economy (Tymoigne, 2008)
Results of the active government intervention for the U.S. economy (Tymoigne, 2008)
Слайд 46Stability is destabilizing!
Profit-seeking firms have incentives to leverage and borrow more against
Stability is destabilizing!
Profit-seeking firms have incentives to leverage and borrow more against
Слайд 47Let me give examples of three empirical studies of the financial fragility’s
Let me give examples of three empirical studies of the financial fragility’s
Слайд 48Empirical analysis of the Greek companies’ financing regimes on the base of
Empirical analysis of the Greek companies’ financing regimes on the base of
Слайд 49Some details about this analysis and this index
The ASE General Index includes
Some details about this analysis and this index
The ASE General Index includes
Слайд 50The Indicator used for the Greek companies’ classification
The Indicator used for the Greek companies’ classification
Слайд 51Explanation of the Indicator
EBIT = earnings before interest and taxes
Interest Coverage Ratio
Explanation of the Indicator
EBIT = earnings before interest and taxes
Interest Coverage Ratio
Слайд 52The Principles of The Greek companies’ classification
ICR>=3 treated as a financially “healthy”
The Principles of The Greek companies’ classification
ICR>=3 treated as a financially “healthy”
Слайд 53The dynamics of 36 Greek companies during the period in question
After
The dynamics of 36 Greek companies during the period in question
After
Слайд 54The essential diagram (2001-2014)
The essential diagram (2001-2014)
Слайд 55Some Conclusions
Experience of the Greek economy is consistent with the FIH.
In the
Some Conclusions
Experience of the Greek economy is consistent with the FIH.
In the
Слайд 56Analysis of the financial fragility’s evolution in Japan (Nishi, 2019)
Nishi analyzed firms
Analysis of the financial fragility’s evolution in Japan (Nishi, 2019)
Nishi analyzed firms
Слайд 57More about Nishi (2019)
So, Nishi used alternative criterion for classifying regimes of
More about Nishi (2019)
So, Nishi used alternative criterion for classifying regimes of
Слайд 58Evolution of financial fragility for Large Manufacturing Japanese firms (1975-2015)
Evolution of financial fragility for Large Manufacturing Japanese firms (1975-2015)
Слайд 59Evolution of financial fragility for Small Manufacturing Japanese firms (1975-2015)
Evolution of financial fragility for Small Manufacturing Japanese firms (1975-2015)
Слайд 60Evolution of financial fragility for Large Non-Manufacturing Japanese firms (1975-2015)
Evolution of financial fragility for Large Non-Manufacturing Japanese firms (1975-2015)
Слайд 61Evolution of financial fragility for Small Non-Manufacturing Japanese firms (1975-2015)
Evolution of financial fragility for Small Non-Manufacturing Japanese firms (1975-2015)
Слайд 62Some conclusions from Nishi (2019)
Ponzi finance becomes popular before and during the
Some conclusions from Nishi (2019)
Ponzi finance becomes popular before and during the
Слайд 63The example of latest research – for the South Korean private nonfinancial
The example of latest research – for the South Korean private nonfinancial
Слайд 64Dynamics of different regimes of financing by the leading 102 South Korean
Dynamics of different regimes of financing by the leading 102 South Korean
Слайд 65Dynamics of different regimes of financing by the leading 102 South Korean
Dynamics of different regimes of financing by the leading 102 South Korean
 Программно-методический комплекс ОРГ-МАСТЕР ®Графикс
 English speaking countries
 Сады сбываются. Сад по-новому
 Презентация на тему Педагогический опыт работы учителя английского языка
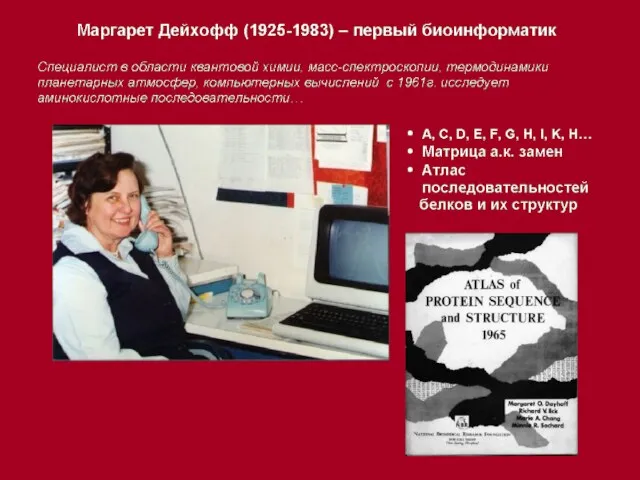 The PIR-PSD current release 78.03, November 24, 2003, contains 283366 entries. 65 proteins The PIR was established in 1984 by the National Biomedical.
 Проектирование региональных МИС
 Всероссийский физкультурно - спортивный комплекс Готов к труду и обороне (ГТО)
 Благотворительный фонд помощи пострадавшим в дорожно-транспортных происшествиях СтопДТП
 Выбор
Выбор Считалки на английском
  Развитие социальной психологии
 Историческое развитие человечества: поиски социальной макротеории
 Коммерческое предложение по ГБО для таксомоторных парков от Гарант-Газ
 Государственная Третьяковская галерея
 Космограммы студентов
 Об организации работы в УПФР в Увинском районе по приему и обработке заявлений о перерасчете по нестраховым периодам
 Республике Карелия 85 лет
 Современный мир 10 класс
 Архитектурный дизайн городской среды
 Омплексное решение для вашего бизнеса
 Stratagy of future
 Открытый урок
 79a28ae3aada471eb2bf6b04f93de9cc
 Тренинг по решению конфликтов среди подростков
 Правописание гласных после шипящих и Ц
 «Мой край родной, люблю тебя...»(создание экскурсионного маршрута)
 Мосгормаш -технопарк будущего
 Обеспечение