- Perfect competition

Содержание
- 2. What is market structure? Important features of a market, such as the number of firms, product
- 3. What are the four types of Markets? Perfect Competition Monopolistic Competition Oligopoly Monopoly
- 4. What is a perfectly competitive market? homogeneous product many buyers and sellers no one has much
- 5. What is a price taker? A firm that faces a given market price and whose actions
- 6. Why is a firm that is part of a perfectly competitive market a price taker? Because
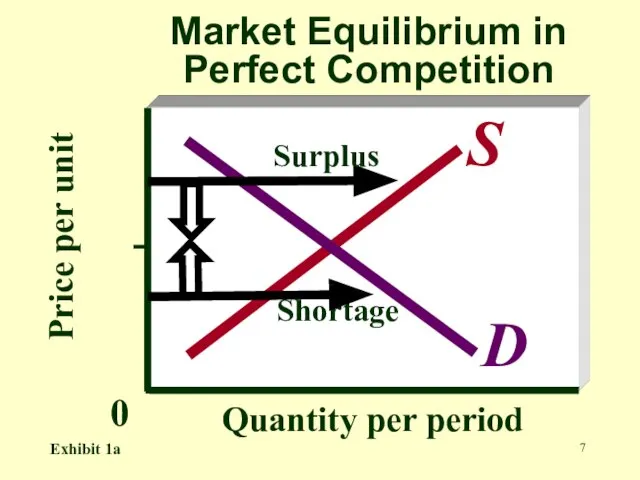
- 7. Price per unit Quantity per period Market Equilibrium in Perfect Competition D S 0 Exhibit 1a
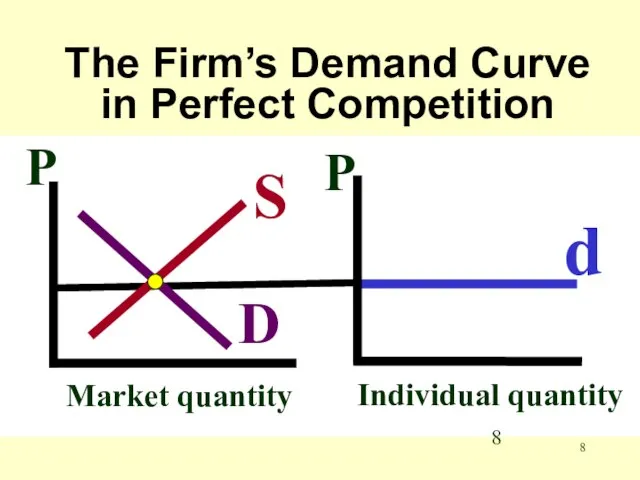
- 8. The Firm’s Demand Curve in Perfect Competition Market quantity P S D Individual quantity P d
- 9. How does the firm maximize profit? By finding the rate of output that makes total revenue
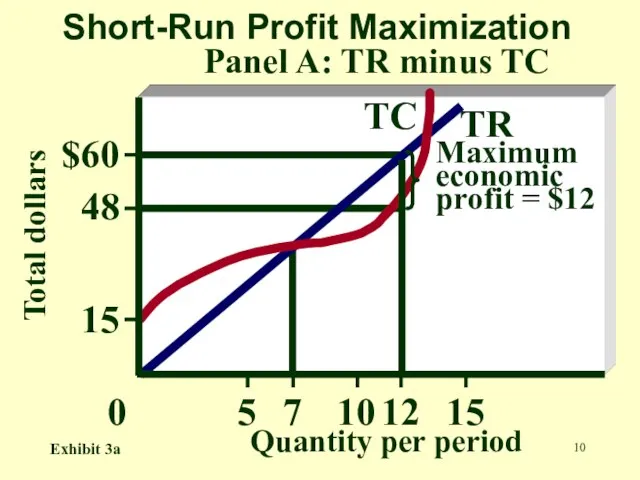
- 10. 7 Maximum economic profit = $12 12 TR TC $60 48 15 Total dollars Quantity per
- 11. What is marginal revenue? The change in total revenue resulting from a one-unit change in sales
- 12. What is marginal cost? The change in total cost resulting from a one-unit change in sales
- 13. At what point are profits maximized? At the level of output where MR = MC, or
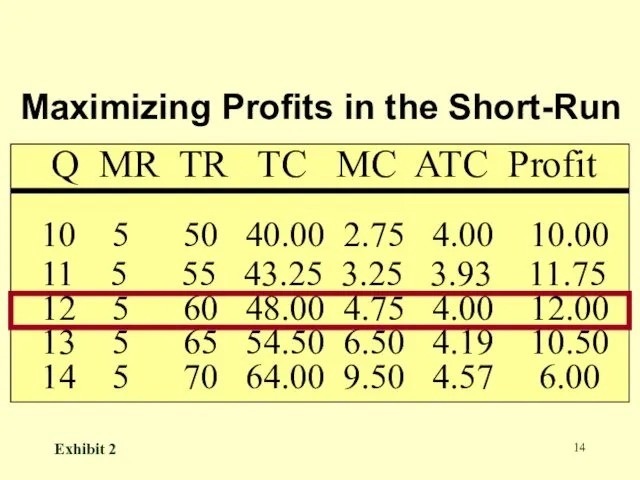
- 14. Q MR TR TC MC ATC Profit 10 5 50 40.00 2.75 4.00 10.00 11 5
- 15. Why does MR = P in Perfect Competition? Because no matter how many units are brought
- 16. What is average revenue? Total revenue divided by output TR / Q
- 17. Why does AR=P in all markets? Because each unit is sold for the same price at
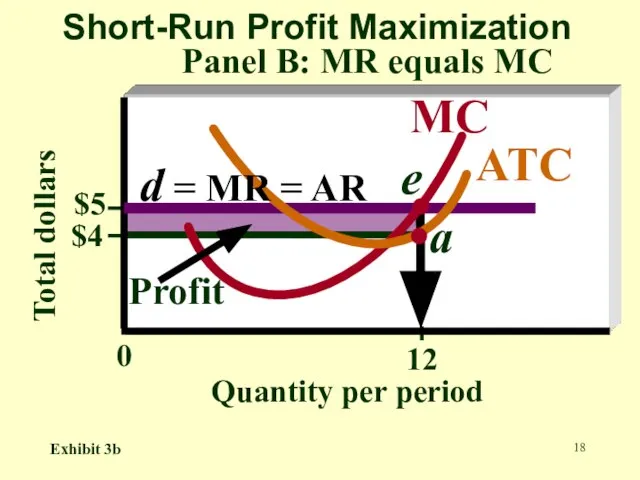
- 18. Total dollars Quantity per period Short-Run Profit Maximization Panel B: MR equals MC 12 0 $5
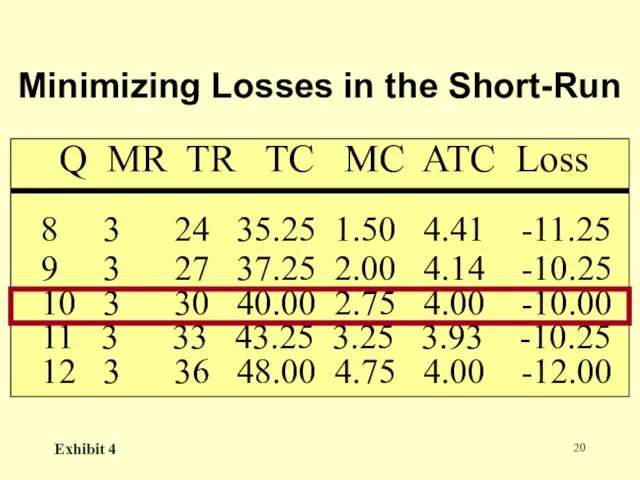
- 19. At what point are losses minimized? At the level of output where MR = MC, or
- 20. Q MR TR TC MC ATC Loss 8 3 24 35.25 1.50 4.41 -11.25 9 3
- 21. What will a firm do if average variable cost exceeds price at every level of production?
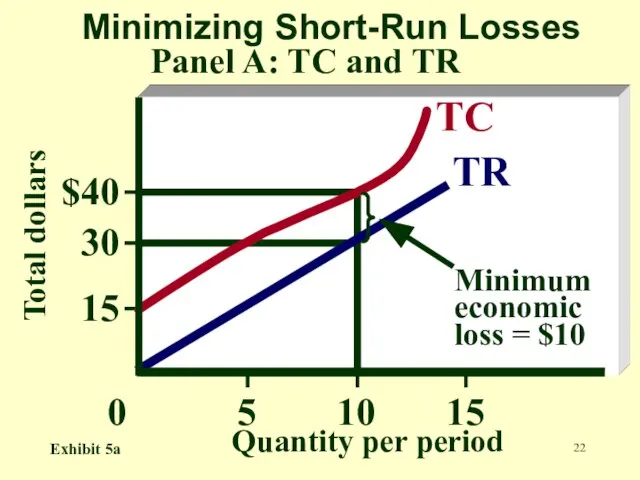
- 22. $40 30 15 Total dollars Quantity per period Minimizing Short-Run Losses 15 10 5 0 Minimum
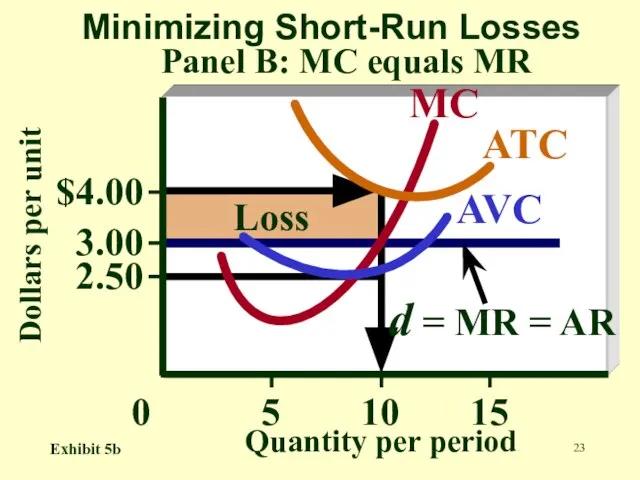
- 23. $4.00 3.00 2.50 15 10 5 0 Dollars per unit Quantity per period Minimizing Short-Run Losses
- 24. What is the firm’s short-run supply curve? A curve that indicates the quantity a firm supplies
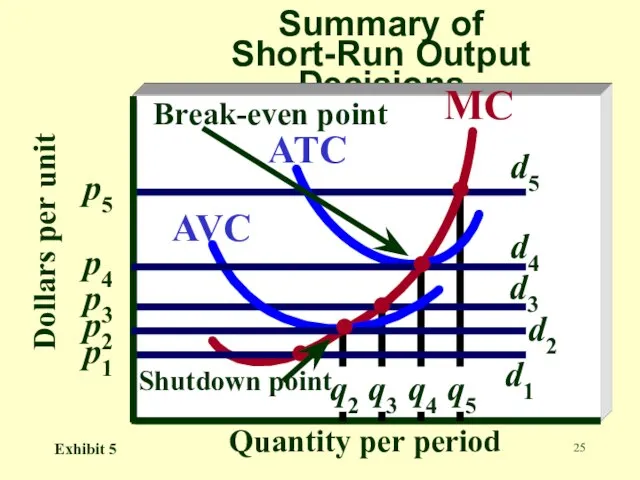
- 25. Dollars per unit Quantity per period Summary of Short-Run Output Decisions MC ATC AVC Shutdown point
- 26. What is the firm’s short run supply curve? That portion of its MC curve which lies
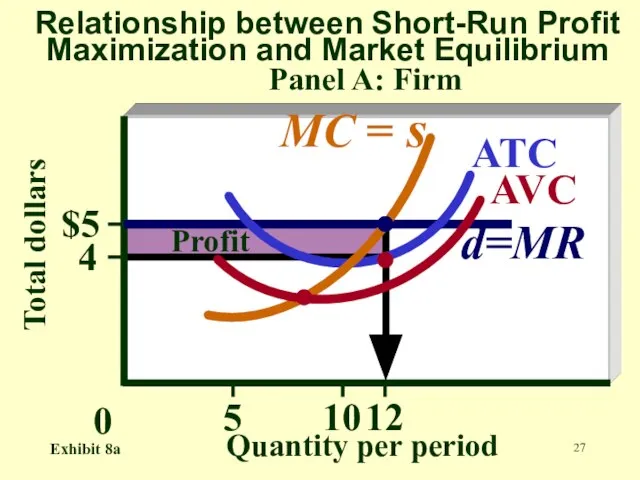
- 27. Total dollars Quantity per period Relationship between Short-Run Profit Maximization and Market Equilibrium Panel A: Firm
- 28. What is the industry’s short-run supply curve? A curve that indicates the quantity all firms in
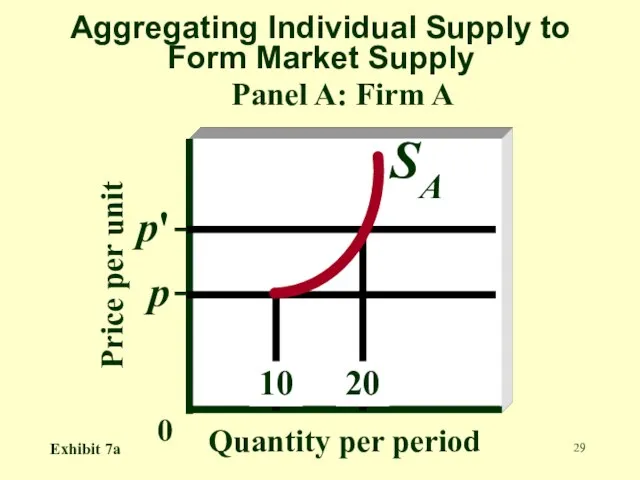
- 29. Aggregating Individual Supply to Form Market Supply Panel A: Firm A Price per unit Quantity per
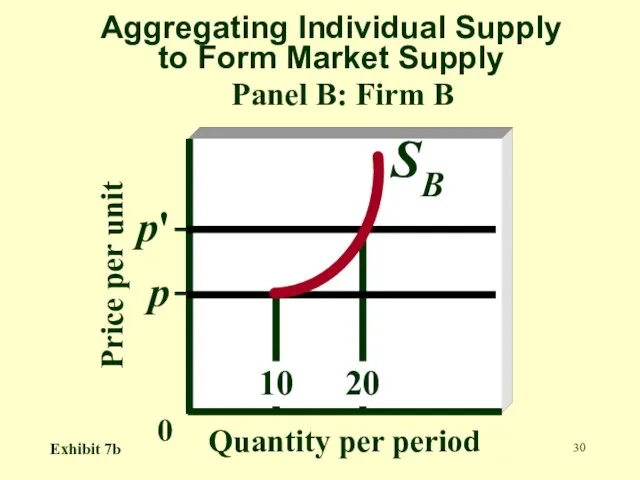
- 30. Aggregating Individual Supply to Form Market Supply Panel B: Firm B Price per unit Quantity per
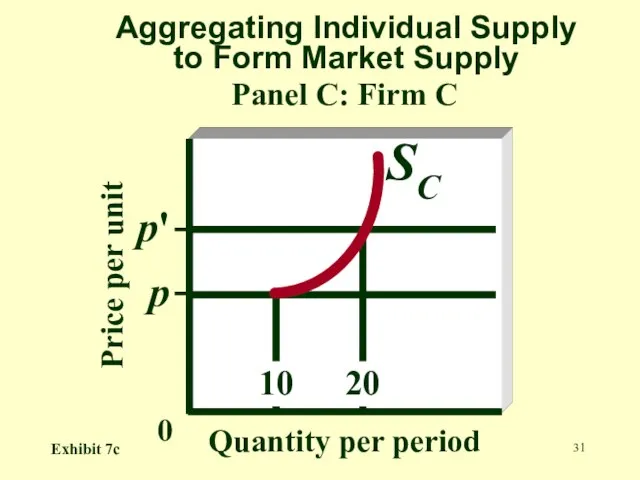
- 31. Aggregating Individual Supply to Form Market Supply Panel C: Firm C Price per unit Quantity per
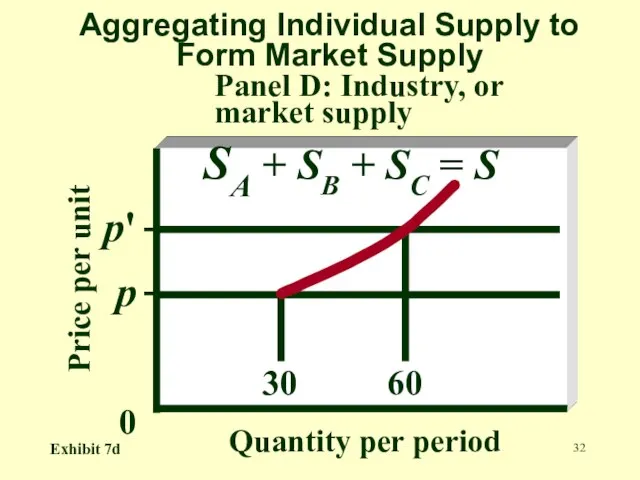
- 32. Aggregating Individual Supply to Form Market Supply Panel D: Industry, or market supply Price per unit
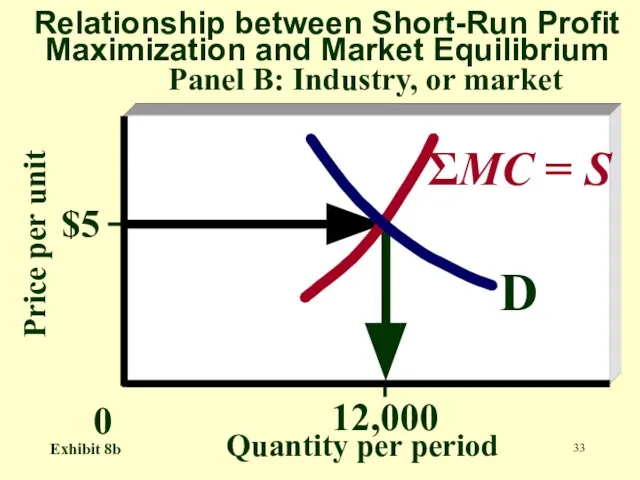
- 33. Price per unit Quantity per period Relationship between Short-Run Profit Maximization and Market Equilibrium Panel B:
- 34. What is economic profit in the long run? Zero
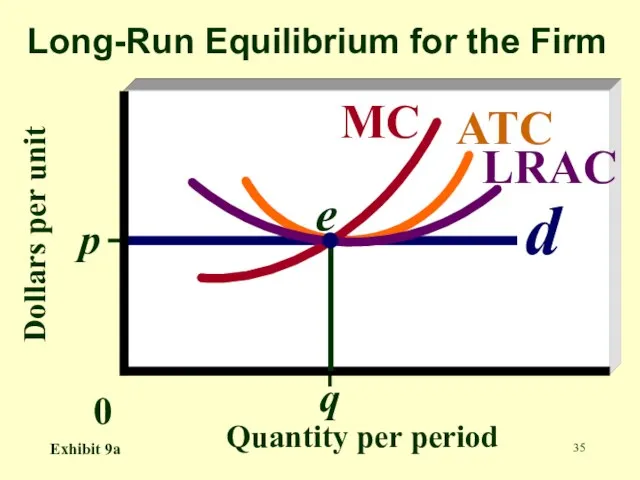
- 35. Dollars per unit Quantity per period Long-Run Equilibrium for the Firm q 0 p d ATC
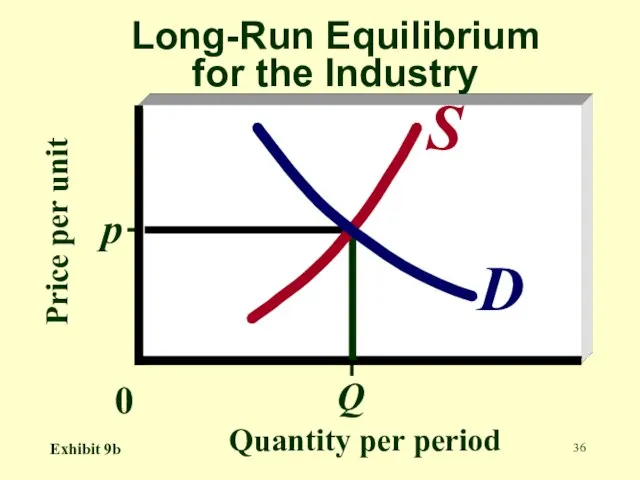
- 36. Price per unit Quantity per period Long-Run Equilibrium for the Industry Q 0 p D S
- 37. What is the long-run industry supply curve? A curve that shows the relationship between price and
- 38. What is an increasing-cost industry? An industry that faces higher per-unit production costs as industry output
- 39. Upward sloping What is the shape of the long-run industry supply curve in an increasing cost
- 40. What is production efficiency? The condition that exists when output is produced with the least-cost combination
- 41. What is allocative efficiency? The condition that exists when firms produce the output that is most
- 42. What is the the marginal cost of each good equal to? The marginal benefit consumers derive
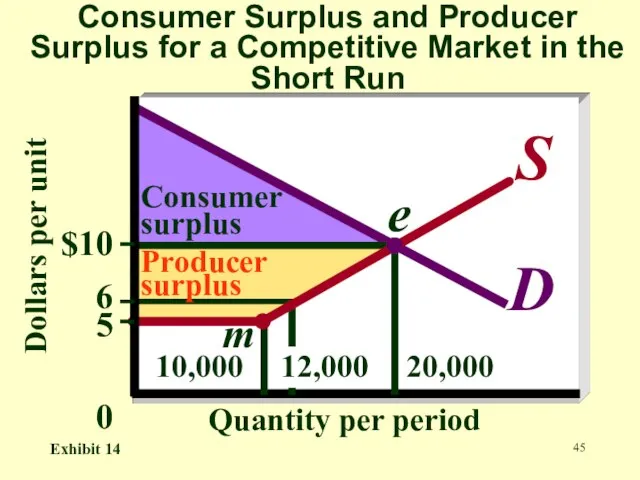
- 43. What is consumer surplus? The difference between the maximum amount that a consumer is willing to
- 44. What is producer surplus? The amount by which total revenue from production exceeds total variable cost
- 45. Consumer Surplus and Producer Surplus for a Competitive Market in the Short Run Dollars per unit
- 46. END
- 47. Appendix
- 48. What is a constant-cost industry? An industry that can expand or contract without affecting the long-run
- 49. What is the shape of the long-run industry supply curve? horizontal
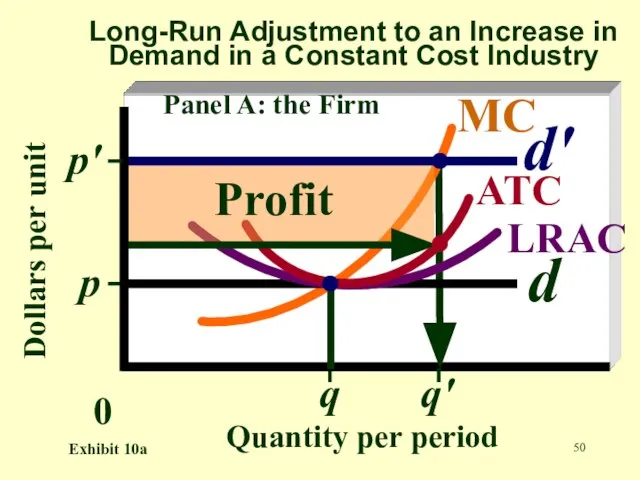
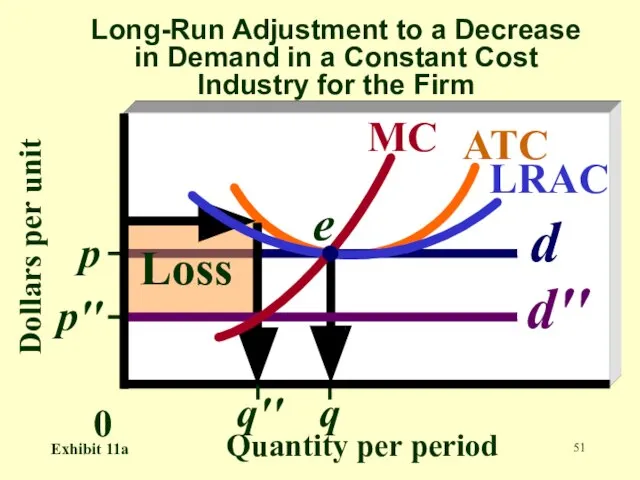
- 50. Dollars per unit Quantity per period q 0 p d ATC MC LRAC d' Profit q'
- 51. Dollars per unit Quantity per period Long-Run Adjustment to a Decrease in Demand in a Constant
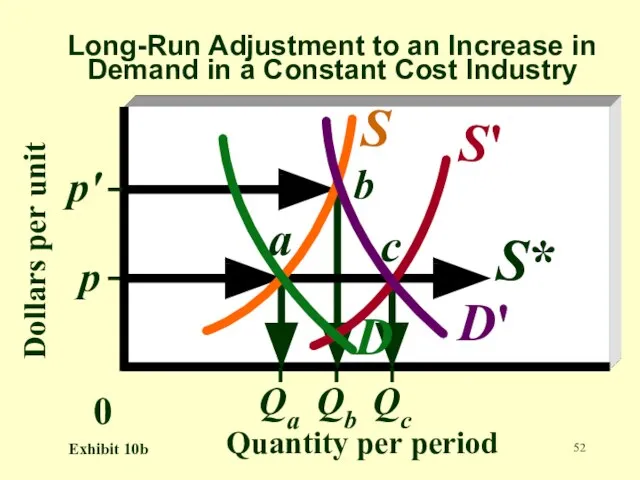
- 52. Dollars per unit Quantity per period Long-Run Adjustment to an Increase in Demand in a Constant
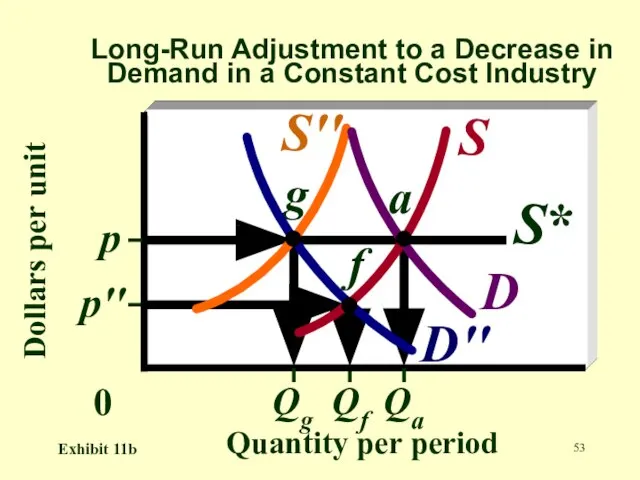
- 53. Dollars per unit Quantity per period Qf 0 p'' Qa p Qg S* S S'' D
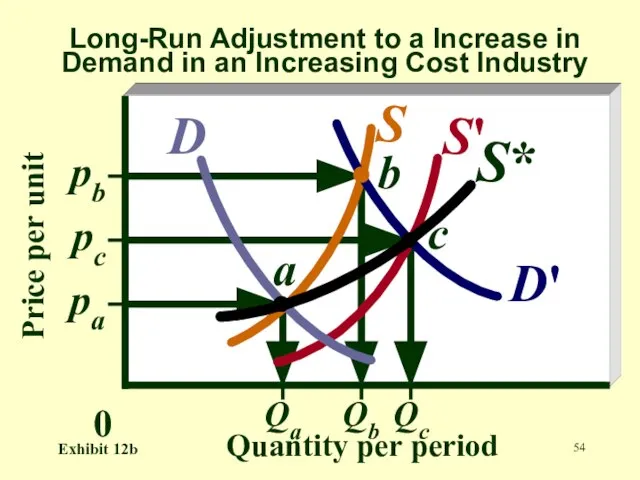
- 54. Price per unit Quantity per period Qb 0 pa pc pb Qc Qa S* S' S
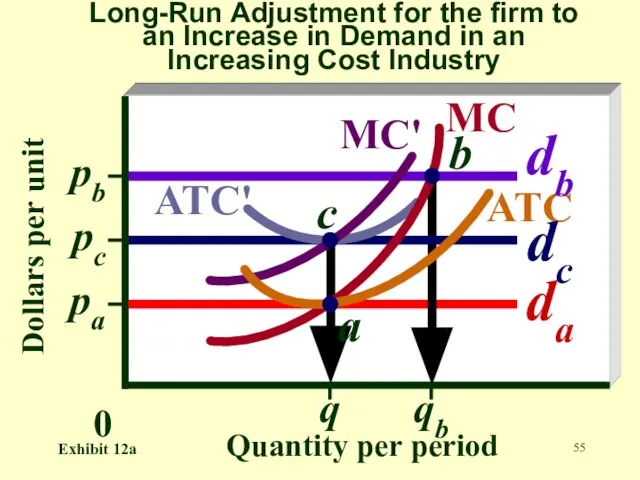
- 55. Dollars per unit Quantity per period qb 0 pa da ATC MC' a pc q dc
- 56. What is a decreasing-cost industry? The rare case in which an industry faces lower per-unit production
- 57. Downward sloping What is the shape of the long-run industry supply curve in a decreasing cost
- 59. Скачать презентацию
Слайд 3What are the four types of Markets?
Perfect Competition
Monopolistic Competition
Oligopoly
Monopoly
What are the four types of Markets?
Perfect Competition
Monopolistic Competition
Oligopoly
Monopoly

Слайд 4What is a
perfectly competitive market?
homogeneous product
many buyers and sellers
no one
What is a
perfectly competitive market?
homogeneous product
many buyers and sellers
no one

Слайд 5What is a price taker?
A firm that faces a given market price
What is a price taker?
A firm that faces a given market price
Слайд 6Why is a firm that is part of a perfectly competitive market
Why is a firm that is part of a perfectly competitive market
Слайд 7Price per unit
Quantity per period
Market Equilibrium in Perfect Competition
D
S
0
Exhibit 1a
Surplus
Shortage
Price per unit
Quantity per period
Market Equilibrium in Perfect Competition
D
S
0
Exhibit 1a
Surplus
Shortage
Слайд 8The Firm’s Demand Curve in Perfect Competition
Market quantity
P
S
D
Individual quantity
P
d
The Firm’s Demand Curve in Perfect Competition
Market quantity
P
S
D
Individual quantity
P
d
Слайд 9How does the firm maximize profit?
By finding the rate of output that
How does the firm maximize profit?
By finding the rate of output that
Слайд 107
Maximum economic profit = $12
12
TR
TC
$60
48
15
Total dollars
Quantity per period
Short-Run Profit Maximization
Panel A: TR
7
Maximum economic profit = $12
12
TR
TC
$60
48
15
Total dollars
Quantity per period
Short-Run Profit Maximization
Panel A: TR
Слайд 11What is
marginal revenue?
The change in total revenue resulting from a one-unit
What is
marginal revenue?
The change in total revenue resulting from a one-unit
Слайд 12What is
marginal cost?
The change in total cost resulting from a one-unit
What is
marginal cost?
The change in total cost resulting from a one-unit
Слайд 13At what point are profits maximized?
At the level of output where MR
At what point are profits maximized?
At the level of output where MR
Слайд 14Q MR TR TC MC ATC Profit
10 5 50 40.00 2.75
Q MR TR TC MC ATC Profit
10 5 50 40.00 2.75
Слайд 15Why does MR = P in Perfect Competition?
Because no matter how many
Why does MR = P in Perfect Competition?
Because no matter how many
Слайд 16What is
average revenue?
Total revenue divided by output
TR / Q
What is
average revenue?
Total revenue divided by output
TR / Q
Слайд 17Why does AR=P
in all markets?
Because each unit is sold for the
Why does AR=P
in all markets?
Because each unit is sold for the
Слайд 18Total dollars
Quantity per period
Short-Run Profit Maximization
Panel B: MR equals MC
12
0
$5
$4
Profit
d = MR
Total dollars
Quantity per period
Short-Run Profit Maximization
Panel B: MR equals MC
12
0
$5
$4
Profit
d = MR
Слайд 19At what point are losses minimized?
At the level of output where MR
At what point are losses minimized?
At the level of output where MR
Слайд 20Q MR TR TC MC ATC Loss
8 3 24 35.25 1.50
Q MR TR TC MC ATC Loss
8 3 24 35.25 1.50
Слайд 21What will a firm do if average variable cost exceeds price at
What will a firm do if average variable cost exceeds price at
Слайд 22$40
30
15
Total dollars
Quantity per period
Minimizing Short-Run Losses
15
10
5
0
Minimum economic loss = $10
TR
TC
Panel A: TC
$40
30
15
Total dollars
Quantity per period
Minimizing Short-Run Losses
15
10
5
0
Minimum economic loss = $10
TR
TC
Panel A: TC
Слайд 23$4.00
3.00
2.50
15
10
5
0
Dollars per unit
Quantity per period
Minimizing Short-Run Losses
MC
AVC
ATC
d = MR = AR
Panel B:
$4.00
3.00
2.50
15
10
5
0
Dollars per unit
Quantity per period
Minimizing Short-Run Losses
MC
AVC
ATC
d = MR = AR
Panel B:
Слайд 24What is the firm’s short-run supply curve?
A curve that indicates the quantity
What is the firm’s short-run supply curve?
A curve that indicates the quantity
Слайд 25Dollars per unit
Quantity per period
Summary of Short-Run Output Decisions
MC
ATC
AVC
Shutdown point
Break-even point
d1
d2
d3
d4
d5
Exhibit 5
Dollars per unit
Quantity per period
Summary of Short-Run Output Decisions
MC
ATC
AVC
Shutdown point
Break-even point
d1
d2
d3
d4
d5
Exhibit 5
Слайд 26What is the firm’s short run supply curve?
That portion of its
What is the firm’s short run supply curve?
That portion of its
Слайд 27Total dollars
Quantity per period
Relationship between Short-Run Profit Maximization and Market Equilibrium
Panel A:
Total dollars
Quantity per period
Relationship between Short-Run Profit Maximization and Market Equilibrium
Panel A:
Слайд 28What is the industry’s short-run supply curve?
A curve that indicates the quantity
What is the industry’s short-run supply curve?
A curve that indicates the quantity
Слайд 29Aggregating Individual Supply to Form Market Supply
Panel A: Firm A
Price per unit
Quantity
Aggregating Individual Supply to Form Market Supply
Panel A: Firm A
Price per unit
Quantity
Слайд 30Aggregating Individual Supply to Form Market Supply
Panel B: Firm B
Price per unit
Quantity
Aggregating Individual Supply to Form Market Supply
Panel B: Firm B
Price per unit
Quantity
Слайд 31Aggregating Individual Supply to Form Market Supply
Panel C: Firm C
Price per unit
Quantity
Aggregating Individual Supply to Form Market Supply
Panel C: Firm C
Price per unit
Quantity
Слайд 32Aggregating Individual Supply to Form Market Supply
Panel D: Industry, or market supply
Price
Aggregating Individual Supply to Form Market Supply
Panel D: Industry, or market supply
Price
Слайд 33Price per unit
Quantity per period
Relationship between Short-Run Profit Maximization and Market Equilibrium
Panel
Price per unit
Quantity per period
Relationship between Short-Run Profit Maximization and Market Equilibrium
Panel
Слайд 34What is economic profit in the long run?
Zero
What is economic profit in the long run?
Zero
Слайд 35Dollars per unit
Quantity per period
Long-Run Equilibrium for the Firm
q
0
p
d
ATC
MC
LRAC
e
Exhibit 9a
Dollars per unit
Quantity per period
Long-Run Equilibrium for the Firm
q
0
p
d
ATC
MC
LRAC
e
Exhibit 9a
Слайд 36Price per unit
Quantity per period
Long-Run Equilibrium for the Industry
Q
0
p
D
S
Exhibit 9b
Price per unit
Quantity per period
Long-Run Equilibrium for the Industry
Q
0
p
D
S
Exhibit 9b
Слайд 37What is the long-run industry supply curve?
A curve that shows the relationship
What is the long-run industry supply curve?
A curve that shows the relationship
Слайд 38What is an
increasing-cost industry?
An industry that faces higher per-unit production costs
What is an
increasing-cost industry?
An industry that faces higher per-unit production costs
Слайд 39Upward sloping
What is the shape of the long-run industry supply curve in
Upward sloping
What is the shape of the long-run industry supply curve in
Слайд 40What is
production efficiency?
The condition that exists when output is produced with
What is
production efficiency?
The condition that exists when output is produced with
Слайд 41What is
allocative efficiency?
The condition that exists when firms produce the output
What is
allocative efficiency?
The condition that exists when firms produce the output
Слайд 42What is the the marginal cost of each good equal to?
The marginal
What is the the marginal cost of each good equal to?
The marginal
Слайд 43What is
consumer surplus?
The difference between the maximum amount that a consumer
What is
consumer surplus?
The difference between the maximum amount that a consumer

Слайд 44What is
producer surplus?
The amount by which total revenue from production exceeds
What is
producer surplus?
The amount by which total revenue from production exceeds
Слайд 45Consumer Surplus and Producer Surplus for a Competitive Market in the Short
Consumer Surplus and Producer Surplus for a Competitive Market in the Short
Слайд 46END
END

Слайд 47Appendix
Appendix

Слайд 48What is a
constant-cost industry?
An industry that can expand or contract without
What is a
constant-cost industry?
An industry that can expand or contract without
Слайд 49What is the shape of the long-run industry supply curve?
horizontal
What is the shape of the long-run industry supply curve?
horizontal
Слайд 50Dollars per unit
Quantity per period
q
0
p
d
ATC
MC
LRAC
d'
Profit
q'
p'
Panel A: the Firm
Exhibit 10a
Long-Run Adjustment to an
Dollars per unit
Quantity per period
q
0
p
d
ATC
MC
LRAC
d'
Profit
q'
p'
Panel A: the Firm
Exhibit 10a
Long-Run Adjustment to an
Слайд 51Dollars per unit
Quantity per period
Long-Run Adjustment to a Decrease in Demand in
Dollars per unit
Quantity per period
Long-Run Adjustment to a Decrease in Demand in
Слайд 52Dollars per unit
Quantity per period
Long-Run Adjustment to an Increase in Demand in
Dollars per unit
Quantity per period
Long-Run Adjustment to an Increase in Demand in
Слайд 53Dollars per unit
Quantity per period
Qf
0
p''
Qa
p
Qg
S*
S
S''
D
D''
g
a
f
Exhibit 11b
Long-Run Adjustment to a Decrease in Demand
Dollars per unit
Quantity per period
Qf
0
p''
Qa
p
Qg
S*
S
S''
D
D''
g
a
f
Exhibit 11b
Long-Run Adjustment to a Decrease in Demand
Слайд 54Price per unit
Quantity per period
Qb
0
pa
pc
pb
Qc
Qa
S*
S'
S
D
D'
a
b
c
Exhibit 12b
Long-Run Adjustment to a Increase in Demand
Price per unit
Quantity per period
Qb
0
pa
pc
pb
Qc
Qa
S*
S'
S
D
D'
a
b
c
Exhibit 12b
Long-Run Adjustment to a Increase in Demand
Слайд 55Dollars per unit
Quantity per period
qb
0
pa
da
ATC
MC'
a
pc
q
dc
c
pb
MC
ATC'
db
b
Exhibit 12a
Long-Run Adjustment for the firm to an
Dollars per unit
Quantity per period
qb
0
pa
da
ATC
MC'
a
pc
q
dc
c
pb
MC
ATC'
db
b
Exhibit 12a
Long-Run Adjustment for the firm to an
Слайд 56What is a
decreasing-cost industry?
The rare case in which an industry faces
What is a
decreasing-cost industry?
The rare case in which an industry faces
Слайд 57Downward sloping
What is the shape of the long-run industry supply curve in
Downward sloping
What is the shape of the long-run industry supply curve in
 Презентация на тему Доказательства эволюции животных (7 класс)
  Публичная презентация учителя москвоведения ГОУ ЦО № 1462 Докукиной Натальи Викторовны
 Цифровизация в Казахстане
 О предмете
 Информационно-технологическое обеспечение проведения государственной (итоговой) аттестации выпускников IX классов общеобразоват
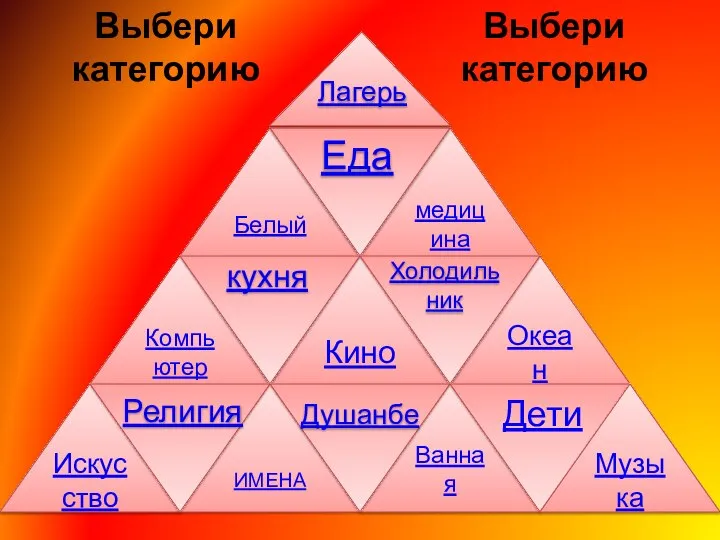 пирамида1
 Информационный бюллетень: религиозный экстремизм
 Игровые технологии для формирования навыков верховой езды
 Обмен липидов-3
 Тема: «Подвижные игры для дошкольников».
 Статус товаров в рамках процедуры прибытия товаров на таможенную территорию Подготовили: Студенты юридического факультета Учеб
 Весенний лед – источник повышенной опасности
 SearchInform MailSniffer
 Материалы для мягкой мебели
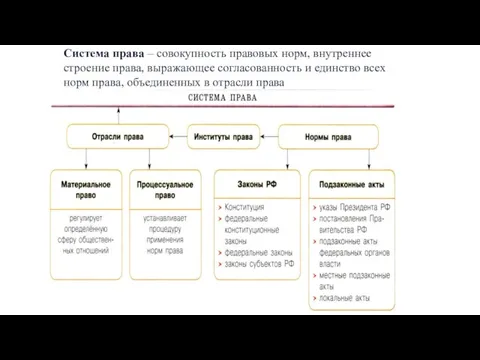 Система права, отрасли права
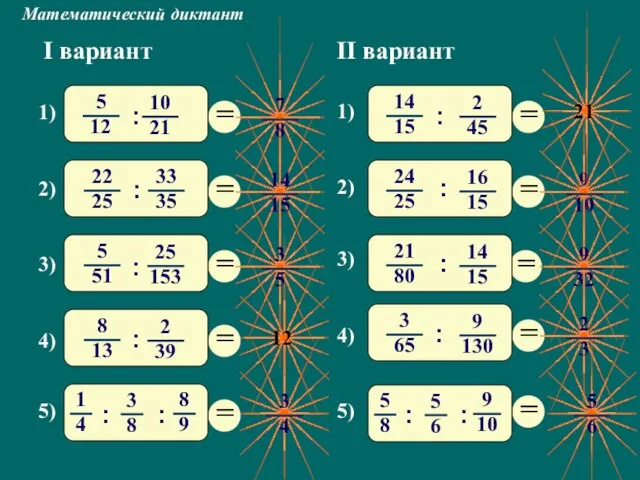 I вариант
 Концепция энергосбережения в 2011 году
 Правила безопасного поведения на воде
 Баланс мощностей в автономной системе электроснабжения. Практическая работа №6
 ОТЧЕТ о научно-практической деятельности отделения неотложной хирургии приобретенных пороков сердца за 2009 год и направления дал
 Зимующие птицы
 Master-banner. Девушка с продуктом Bio Max
 Олимпиады по физике МГУ имени М.В. Ломоносова: победить и поступить !
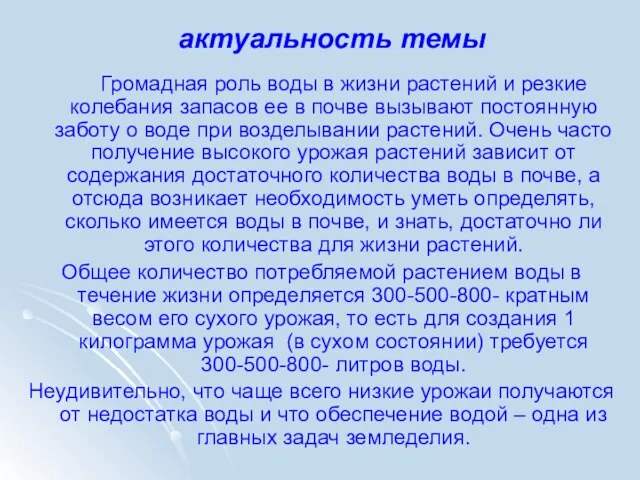 Сколько воды имеется в почве и как это узнать
 Народное прикладное искусство
 Новочебоксарский химико-механический техникум
 PsychedelicWaves из моих OneNote Google. Документы
 Презентация на тему Алгоритмы и исполнители (9 класс)