- Volcanism generated ocean heat waves and biodiversity

Содержание
- 2. Plan Background information Four regional examples of ocean heat waves studied – 2012 North Atlantic Blob
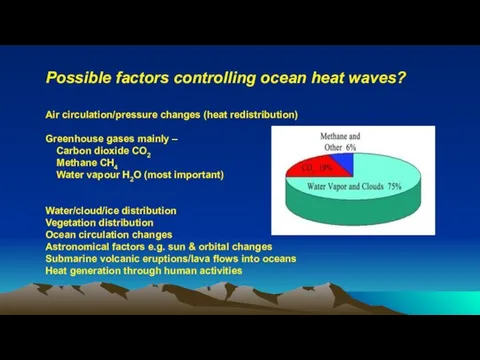
- 3. Possible factors controlling ocean heat waves? Air circulation/pressure changes (heat redistribution) Greenhouse gases mainly – Carbon
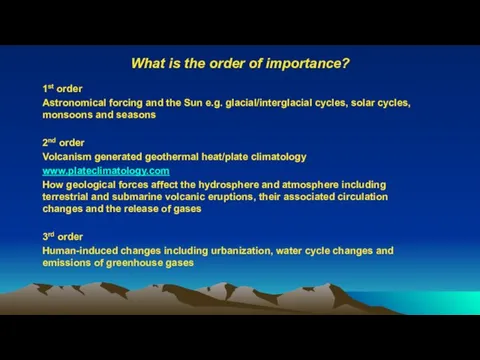
- 4. What is the order of importance? 1st order Astronomical forcing and the Sun e.g. glacial/interglacial cycles,
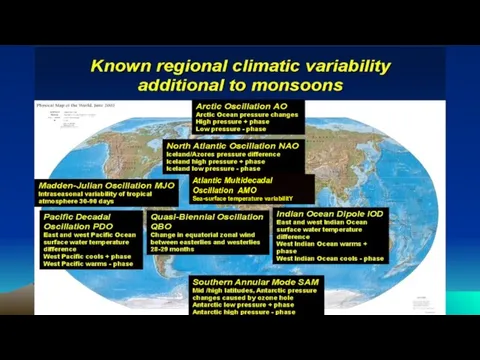
- 5. Atlantic Multidecadal Oscillation AMO Sea-surface temperature variabilitY
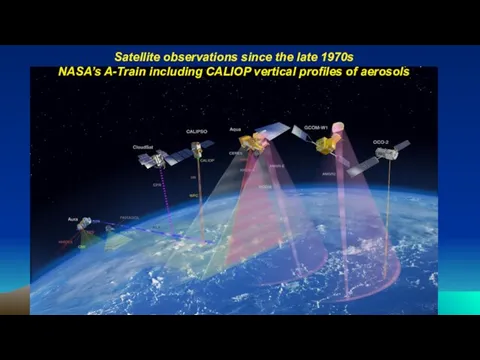
- 6. Satellite observations since the late 1970s NASA’s A-Train including CALIOP vertical profiles of aerosols
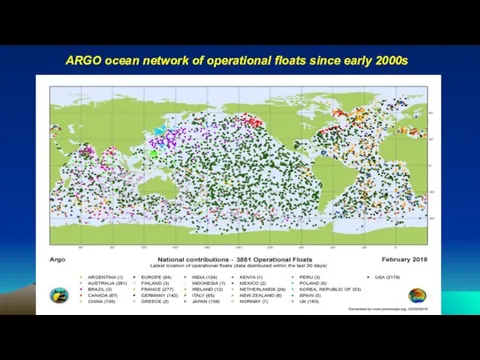
- 7. ARGO ocean network of operational floats since early 2000s
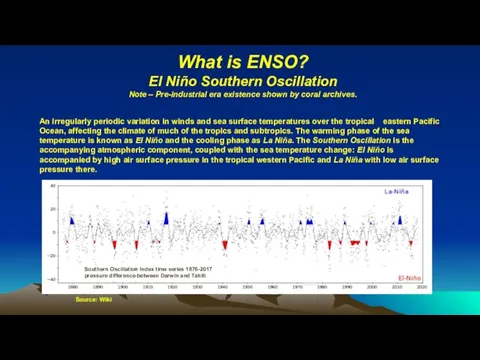
- 8. An irregularly periodic variation in winds and sea surface temperatures over the tropical eastern Pacific Ocean,
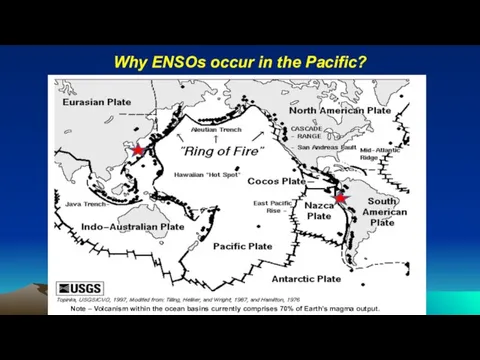
- 9. Why ENSOs occur in the Pacific? Note – Volcanism within the ocean basins currently comprises 70%
- 10. Classification of volcanic eruptions* (1) Sub-aerial / terrestrial - switches on hot air followed by cooling
- 11. ↑ → ← Thermal plume Cooler air Warm air stores more moisture – water vapour redistribution
- 12. Volcanic Explosivity Index (VEI) 8 Above VEI 2 regional impacts on weather already detectable Used for
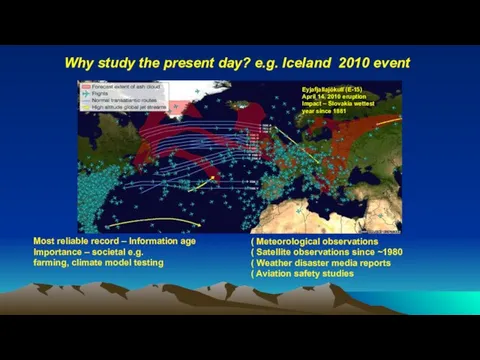
- 13. Why study the present day? e.g. Iceland 2010 event Most reliable record – Information age Importance
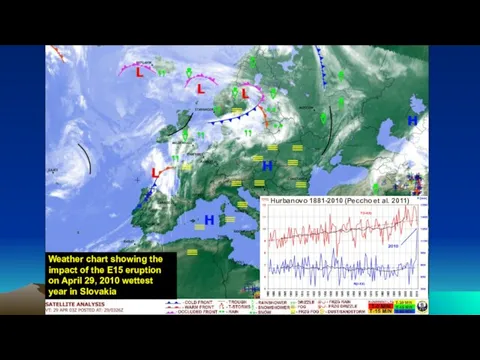
- 14. Weather chart showing the impact of the E15 eruption on April 29, 2010 wettest year in
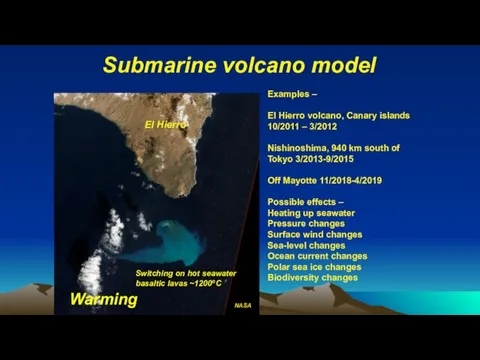
- 15. Submarine volcano model Examples – El Hierro volcano, Canary islands 10/2011 – 3/2012 Nishinoshima, 940 km
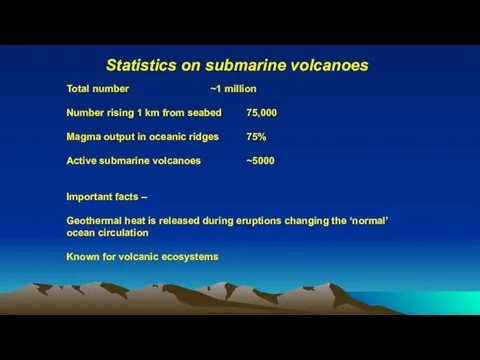
- 16. Statistics on submarine volcanoes Total number ~1 million Number rising 1 km from seabed 75,000 Magma
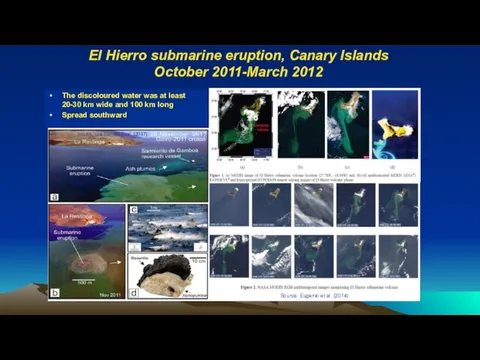
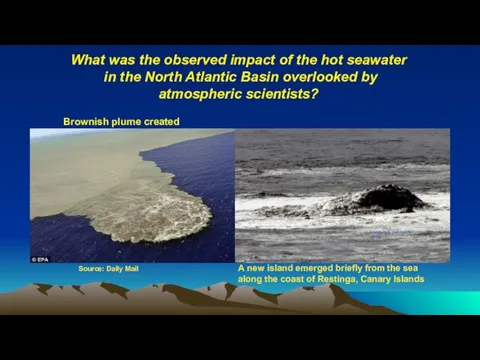
- 17. The discoloured water was at least 20-30 km wide and 100 km long Spread southward Source:
- 18. What was the observed impact of the hot seawater in the North Atlantic Basin overlooked by
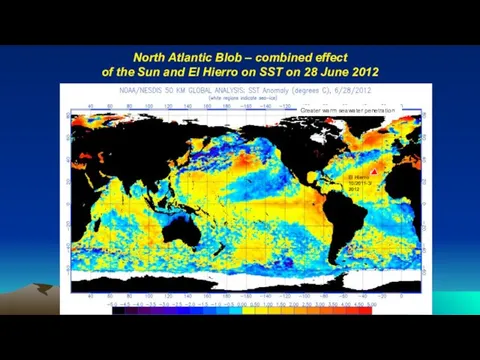
- 19. North Atlantic Blob – combined effect of the Sun and El Hierro on SST on 28
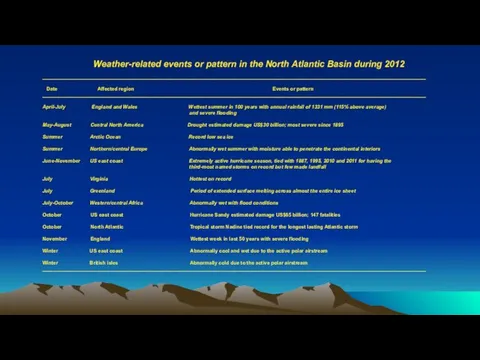
- 20. __________________________________________________________________________________________________________________________________________ Date Affected region Events or pattern __________________________________________________________________________________________________________________________________________ April-July England and Wales Wettest summer in 100
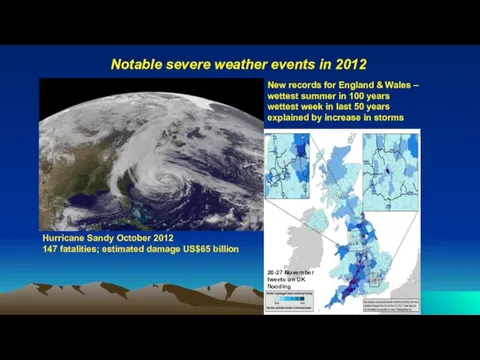
- 21. Notable severe weather events in 2012 Hurricane Sandy October 2012 147 fatalities; estimated damage US$65 billion
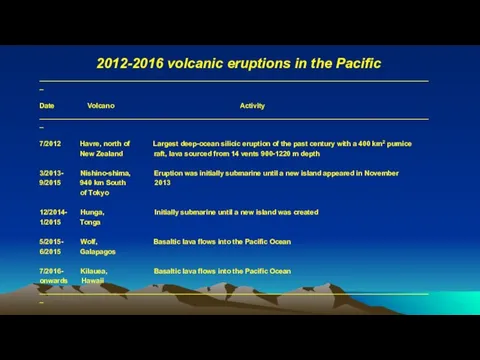
- 22. 2012-2016 volcanic eruptions in the Pacific _____________________________________________________________________________________________________ Date Volcano Activity _____________________________________________________________________________________________________ 7/2012 Havre, north of Largest
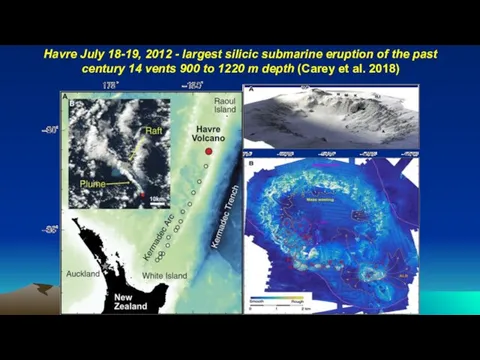
- 23. Havre July 18-19, 2012 - largest silicic submarine eruption of the past century 14 vents 900
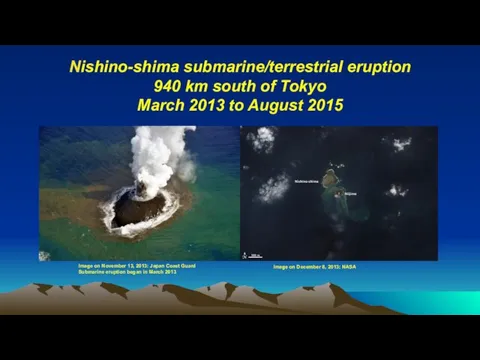
- 24. Nishino-shima submarine/terrestrial eruption 940 km south of Tokyo March 2013 to August 2015 Image on November
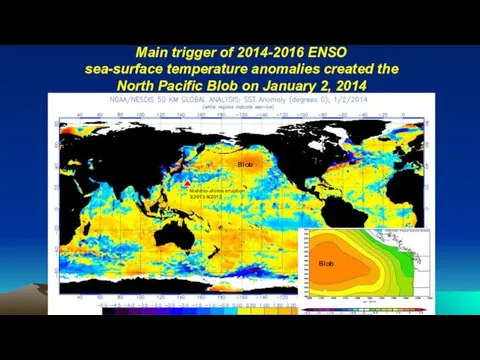
- 25. Main trigger of 2014-2016 ENSO sea-surface temperature anomalies created the North Pacific Blob on January 2,
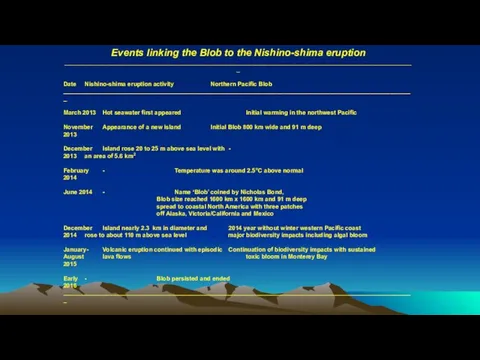
- 26. Events linking the Blob to the Nishino-shima eruption _________________________________________________________________________________________________________ Date Nishino-shima eruption activity Northern Pacific Blob
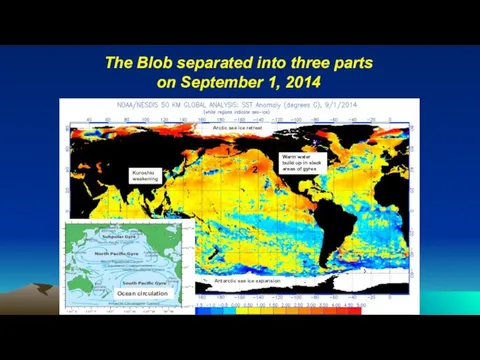
- 27. The Blob separated into three parts on September 1, 2014 1 2 3 Ocean circulation Warm
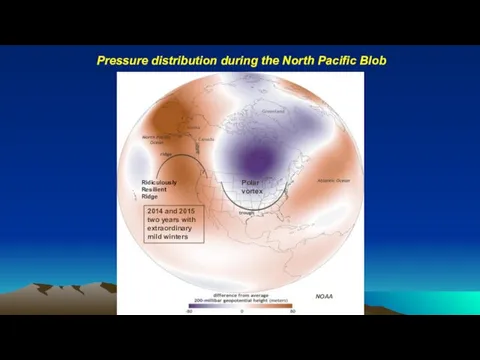
- 28. Pressure distribution during the North Pacific Blob NOAA Ridiculously Resilient Ridge 2014 and 2015 two years
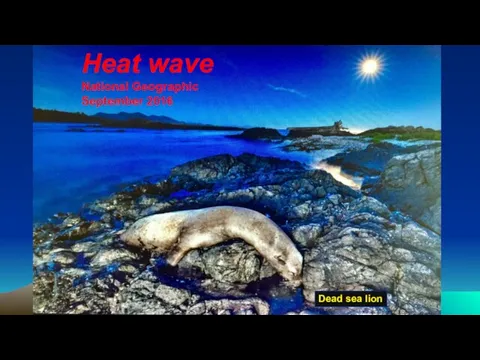
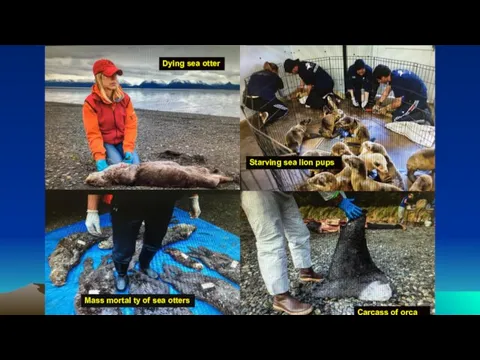
- 29. Heat wave National Geographic September 2016 Dead sea lion
- 30. Dying sea otter Mass mortality of sea otters Starving sea lion pups Carcass of orca
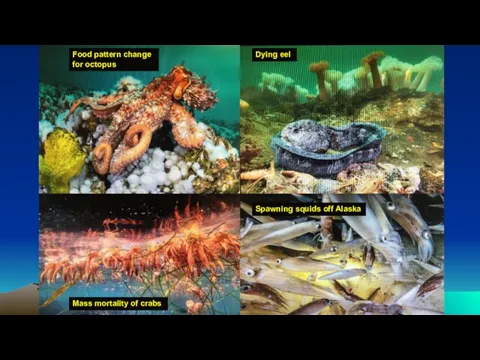
- 31. Food pattern change for octopus Dying eel Mass mortality of crabs Spawning squids off Alaska
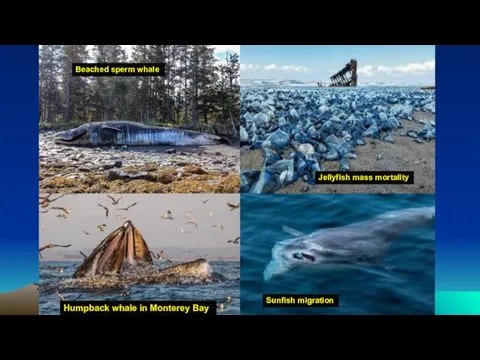
- 32. Beached sperm whale Humpback whale in Monterey Bay Jellyfish mass mortality Sunfish migration
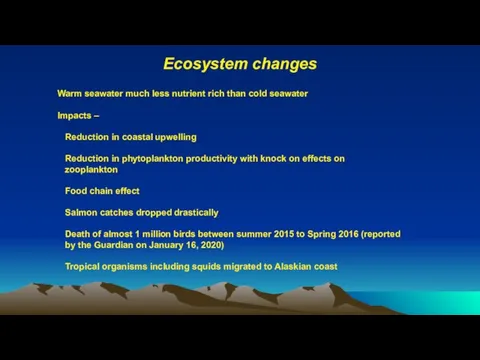
- 33. Ecosystem changes Warm seawater much less nutrient rich than cold seawater Impacts – Reduction in coastal
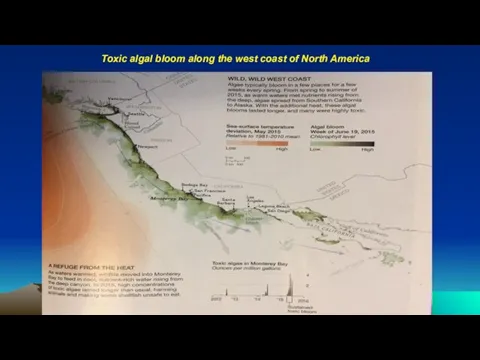
- 34. Toxic algal bloom along the west coast of North America
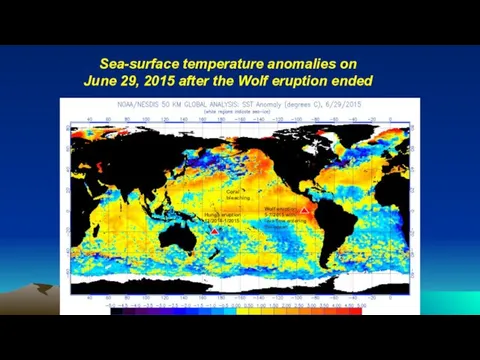
- 35. Sea-surface temperature anomalies on June 29, 2015 after the Wolf eruption ended Wolf eruption 5-7/2015 with
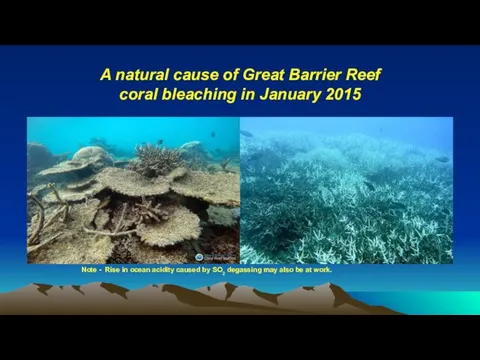
- 36. A natural cause of Great Barrier Reef coral bleaching in January 2015 Note - Rise in
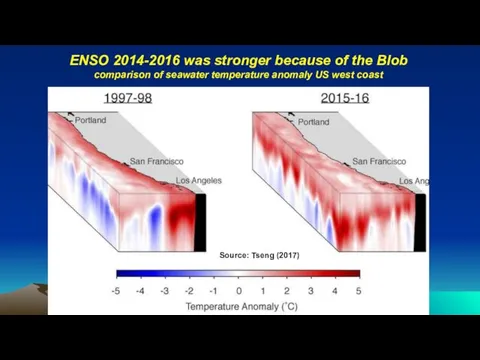
- 37. ENSO 2014-2016 was stronger because of the Blob comparison of seawater temperature anomaly US west coast
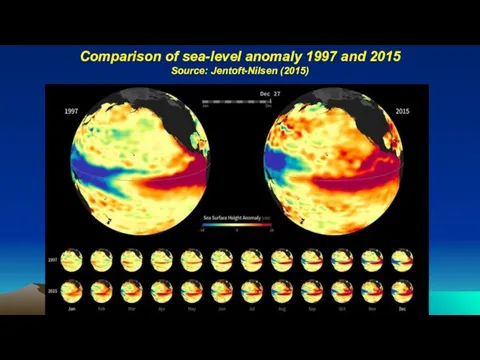
- 38. Comparison of sea-level anomaly 1997 and 2015 Source: Jentoft-Nilsen (2015)
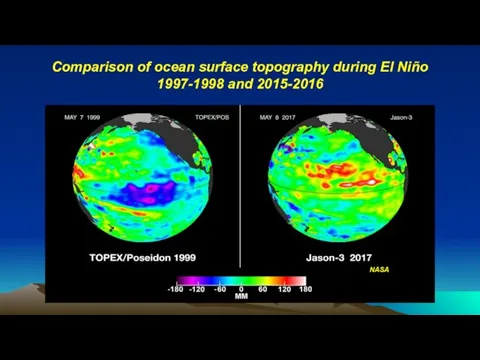
- 39. Comparison of ocean surface topography during El Niño 1997-1998 and 2015-2016 NASA
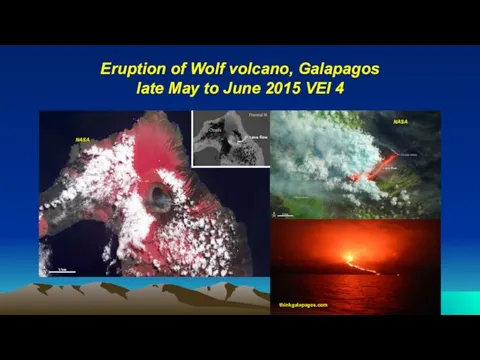
- 40. Eruption of Wolf volcano, Galapagos late May to June 2015 VEI 4 NASA thinkgalapagos.com NASA NASA
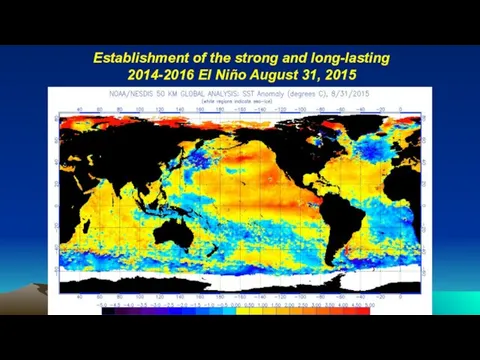
- 41. Establishment of the strong and long-lasting 2014-2016 El Niño August 31, 2015
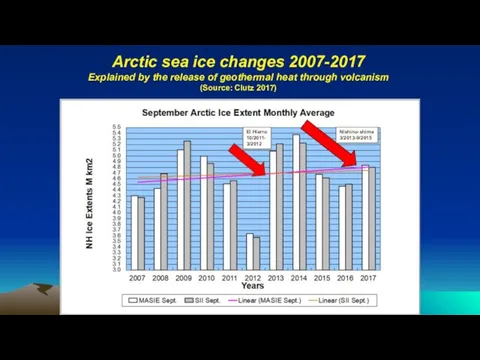
- 42. Arctic sea ice changes 2007-2017 Explained by the release of geothermal heat through volcanism (Source: Clutz
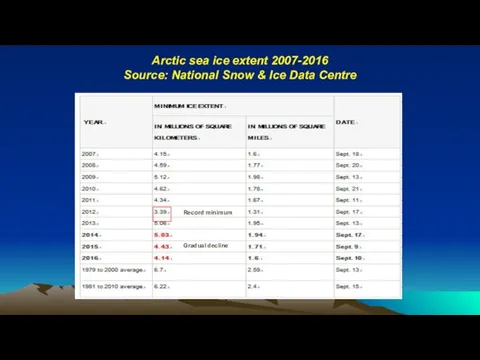
- 43. Arctic sea ice extent 2007-2016 Source: National Snow & Ice Data Centre Record minimum Gradual decline
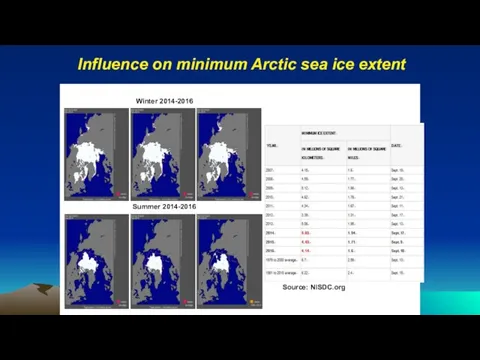
- 44. Influence on minimum Arctic sea ice extent Winter 2014-2016 Summer 2014-2016 Source: NISDC.org
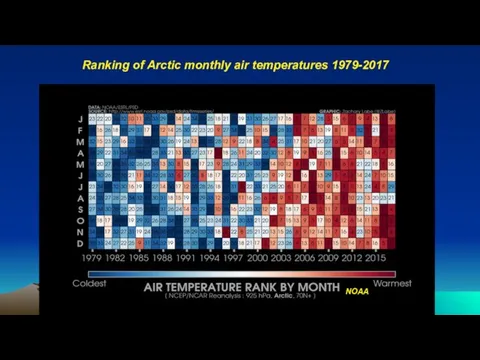
- 45. Ranking of Arctic monthly air temperatures 1979-2017 NOAA
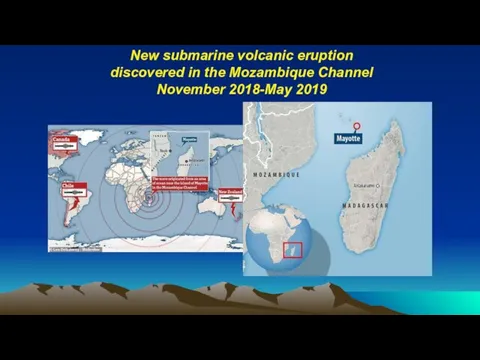
- 46. New submarine volcanic eruption discovered in the Mozambique Channel November 2018-May 2019
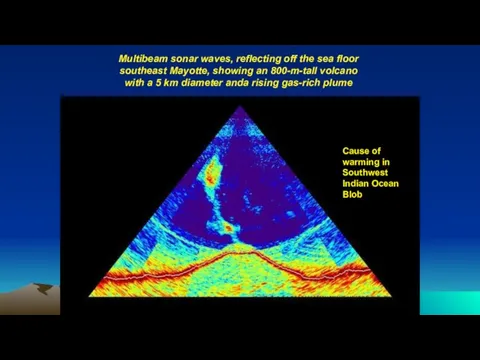
- 47. Multibeam sonar waves, reflecting off the sea floor southeast Mayotte, showing an 800-m-tall volcano with a
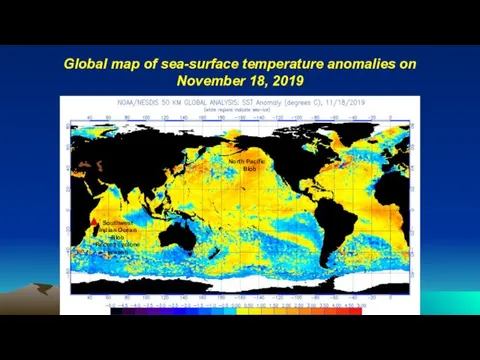
- 48. Global map of sea-surface temperature anomalies on November 18, 2019 North Pacific Blob Southwest Indian Ocean
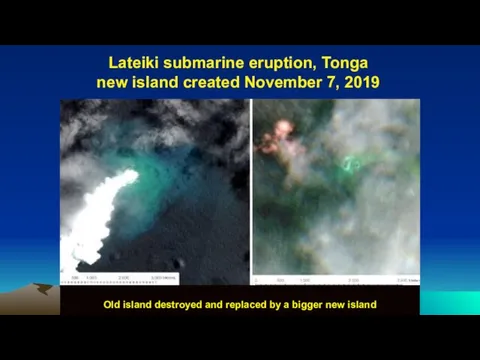
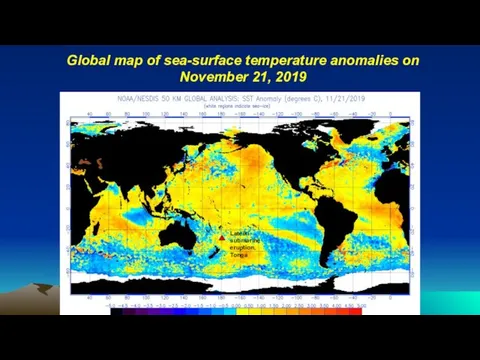
- 49. Lateiki submarine eruption, Tonga new island created November 7, 2019 Old island destroyed and replaced by
- 50. Global map of sea-surface temperature anomalies on November 21, 2019 Lateiki submarine eruption, Tonga
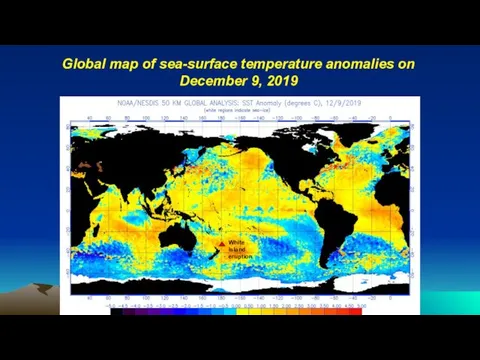
- 51. Global map of sea-surface temperature anomalies on December 9, 2019 White Island eruption
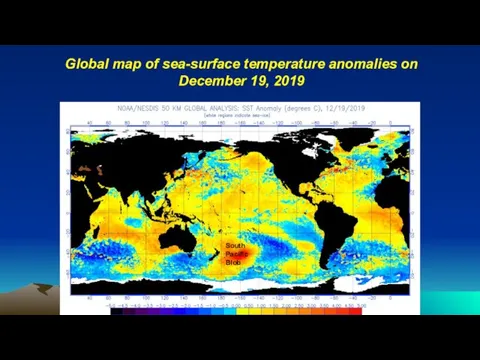
- 52. Global map of sea-surface temperature anomalies on December 19, 2019 South Pacific Blob
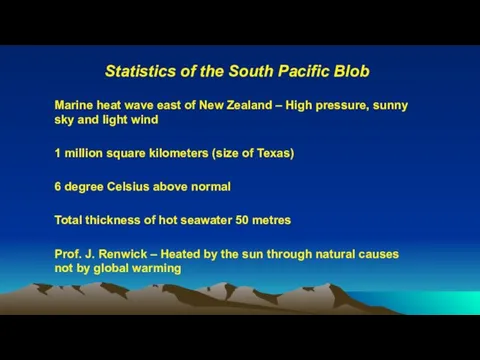
- 53. Statistics of the South Pacific Blob Marine heat wave east of New Zealand – High pressure,
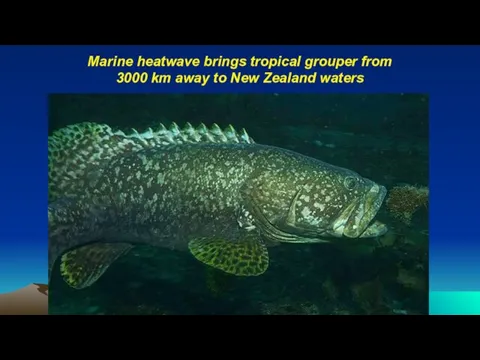
- 54. Marine heatwave brings tropical grouper from 3000 km away to New Zealand waters
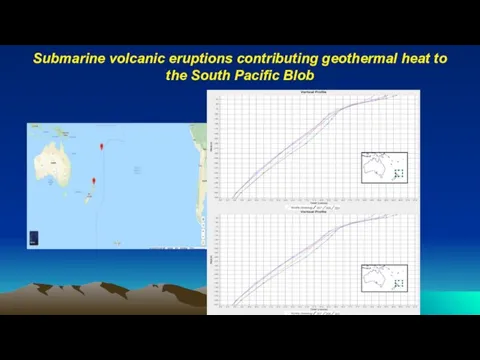
- 55. Submarine volcanic eruptions contributing geothermal heat to the South Pacific Blob
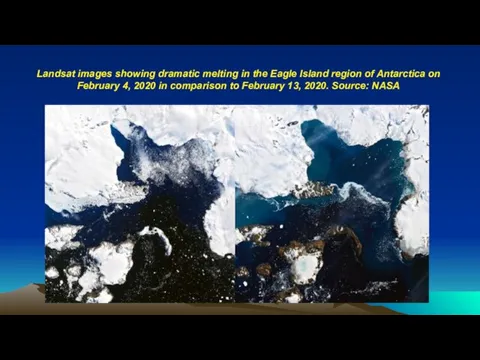
- 56. Landsat images showing dramatic melting in the Eagle Island region of Antarctica on February 4, 2020
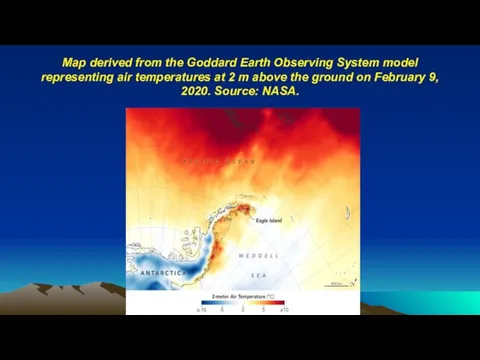
- 57. Map derived from the Goddard Earth Observing System model representing air temperatures at 2 m above
- 59. Скачать презентацию
Слайд 3Possible factors controlling ocean heat waves?
Air circulation/pressure changes (heat redistribution)
Greenhouse gases mainly
Possible factors controlling ocean heat waves?
Air circulation/pressure changes (heat redistribution)
Greenhouse gases mainly
Слайд 4What is the order of importance?
1st order
Astronomical forcing and the Sun e.g.
What is the order of importance?
1st order
Astronomical forcing and the Sun e.g.
Слайд 5Atlantic Multidecadal Oscillation AMO
Sea-surface temperature variabilitY
Atlantic Multidecadal Oscillation AMO
Sea-surface temperature variabilitY
Слайд 6Satellite observations since the late 1970s
NASA’s A-Train including CALIOP vertical profiles of
Satellite observations since the late 1970s
NASA’s A-Train including CALIOP vertical profiles of
Слайд 7ARGO ocean network of operational floats since early 2000s
ARGO ocean network of operational floats since early 2000s
Слайд 8
An irregularly periodic variation in winds and sea surface temperatures over the
An irregularly periodic variation in winds and sea surface temperatures over the
Слайд 9Why ENSOs occur in the Pacific?
Note – Volcanism within the ocean basins
Why ENSOs occur in the Pacific?
Note – Volcanism within the ocean basins
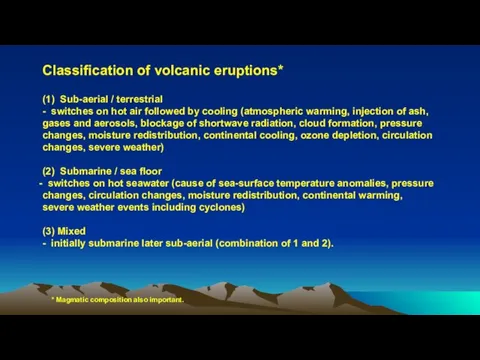
Слайд 10Classification of volcanic eruptions*
(1) Sub-aerial / terrestrial
- switches on hot air followed
Classification of volcanic eruptions*
(1) Sub-aerial / terrestrial
- switches on hot air followed
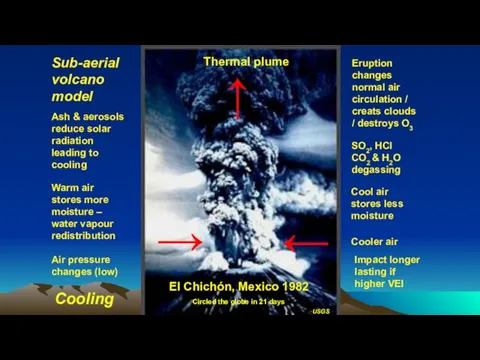
Слайд 11↑
→
←
Thermal plume
Cooler air
Warm air
stores more
moisture –
water vapour
redistribution
Air pressure
changes (low)
Cool air
stores less
moisture
El
↑
→
←
Thermal plume
Cooler air
Warm air
stores more
moisture –
water vapour
redistribution
Air pressure
changes (low)
Cool air
stores less
moisture
El
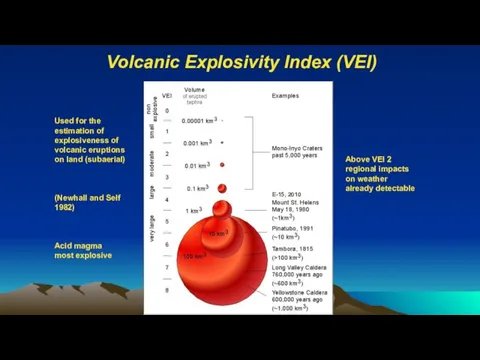
Слайд 12Volcanic Explosivity Index (VEI)
8
Above VEI 2
regional impacts
on weather
already detectable
Used for the
Volcanic Explosivity Index (VEI)
8
Above VEI 2
regional impacts
on weather
already detectable
Used for the
Слайд 13Why study the present day? e.g. Iceland 2010 event
Most reliable record
Why study the present day? e.g. Iceland 2010 event
Most reliable record
Слайд 14Weather chart showing the impact of the E15 eruption on April 29,
Weather chart showing the impact of the E15 eruption on April 29,
Слайд 15Submarine volcano model
Examples –
El Hierro volcano, Canary islands 10/2011 – 3/2012
Nishinoshima, 940
Submarine volcano model
Examples –
El Hierro volcano, Canary islands 10/2011 – 3/2012
Nishinoshima, 940
Слайд 16Statistics on submarine volcanoes
Total number ~1 million
Number rising 1 km from seabed 75,000
Magma output
Statistics on submarine volcanoes
Total number ~1 million
Number rising 1 km from seabed 75,000
Magma output
Слайд 17The discoloured water was at least 20-30 km wide and 100 km
The discoloured water was at least 20-30 km wide and 100 km
Слайд 18What was the observed impact of the hot seawater
in the North
What was the observed impact of the hot seawater in the North
Слайд 19North Atlantic Blob – combined effect
of the Sun and El Hierro on
North Atlantic Blob – combined effect of the Sun and El Hierro on
Слайд 20__________________________________________________________________________________________________________________________________________
Date Affected region Events or pattern
__________________________________________________________________________________________________________________________________________
April-July England and Wales Wettest summer
__________________________________________________________________________________________________________________________________________
Date Affected region Events or pattern
__________________________________________________________________________________________________________________________________________
April-July England and Wales Wettest summer
Слайд 21Notable severe weather events in 2012
Hurricane Sandy October 2012
147 fatalities; estimated damage
Notable severe weather events in 2012
Hurricane Sandy October 2012
147 fatalities; estimated damage
Слайд 222012-2016 volcanic eruptions in the Pacific
_____________________________________________________________________________________________________
Date Volcano Activity
_____________________________________________________________________________________________________
7/2012 Havre, north of Largest
2012-2016 volcanic eruptions in the Pacific
_____________________________________________________________________________________________________
Date Volcano Activity
_____________________________________________________________________________________________________
7/2012 Havre, north of Largest
Слайд 23Havre July 18-19, 2012 - largest silicic submarine eruption of the past
Havre July 18-19, 2012 - largest silicic submarine eruption of the past
Слайд 24Nishino-shima submarine/terrestrial eruption
940 km south of Tokyo
March 2013 to August 2015
Image on
Nishino-shima submarine/terrestrial eruption
940 km south of Tokyo
March 2013 to August 2015
Image on
Слайд 25Main trigger of 2014-2016 ENSO
sea-surface temperature anomalies created the
North Pacific Blob on
Main trigger of 2014-2016 ENSO sea-surface temperature anomalies created the North Pacific Blob on
Слайд 26Events linking the Blob to the Nishino-shima eruption
_________________________________________________________________________________________________________
Date Nishino-shima eruption activity Northern
Date Nishino-shima eruption activity Northern
Слайд 27The Blob separated into three parts
on September 1, 2014
1
2
3
Ocean circulation
Warm water
The Blob separated into three parts
on September 1, 2014
1
2
3
Ocean circulation
Warm water
Слайд 28Pressure distribution during the North Pacific Blob
NOAA
Ridiculously
Resilient
Ridge
2014 and 2015
two years with
extraordinary
mild
Pressure distribution during the North Pacific Blob
NOAA
Ridiculously
Resilient
Ridge
2014 and 2015
two years with
extraordinary
mild
Слайд 29Heat wave
National Geographic
September 2016
Dead sea lion
Heat wave
National Geographic
September 2016
Dead sea lion
Слайд 30Dying sea otter
Mass mortality of sea otters
Starving sea lion pups
Carcass of orca
Dying sea otter
Mass mortality of sea otters
Starving sea lion pups
Carcass of orca
Слайд 31Food pattern change
for octopus
Dying eel
Mass mortality of crabs
Spawning squids off Alaska
Food pattern change
for octopus
Dying eel
Mass mortality of crabs
Spawning squids off Alaska
Слайд 32Beached sperm whale
Humpback whale in Monterey Bay
Jellyfish mass mortality
Sunfish migration
Beached sperm whale
Humpback whale in Monterey Bay
Jellyfish mass mortality
Sunfish migration
Слайд 33Ecosystem changes
Warm seawater much less nutrient rich than cold seawater
Impacts –
Reduction
Ecosystem changes
Warm seawater much less nutrient rich than cold seawater
Impacts –
Reduction
Слайд 34Toxic algal bloom along the west coast of North America
Toxic algal bloom along the west coast of North America
Слайд 35Sea-surface temperature anomalies on
June 29, 2015 after the Wolf eruption ended
Wolf eruption
5-7/2015
Sea-surface temperature anomalies on
June 29, 2015 after the Wolf eruption ended
Wolf eruption
5-7/2015
Слайд 36A natural cause of Great Barrier Reef
coral bleaching in January 2015
Note -
A natural cause of Great Barrier Reef
coral bleaching in January 2015
Note -
Слайд 37ENSO 2014-2016 was stronger because of the Blob
comparison of seawater temperature anomaly
ENSO 2014-2016 was stronger because of the Blob comparison of seawater temperature anomaly
Слайд 38Comparison of sea-level anomaly 1997 and 2015
Source: Jentoft-Nilsen (2015)
Comparison of sea-level anomaly 1997 and 2015
Source: Jentoft-Nilsen (2015)
Слайд 39Comparison of ocean surface topography during El Niño 1997-1998 and 2015-2016
NASA
Comparison of ocean surface topography during El Niño 1997-1998 and 2015-2016
NASA
Слайд 40Eruption of Wolf volcano, Galapagos
late May to June 2015 VEI 4
NASA
thinkgalapagos.com
NASA
NASA
Eruption of Wolf volcano, Galapagos
late May to June 2015 VEI 4
NASA
thinkgalapagos.com
NASA
NASA
Слайд 41Establishment of the strong and long-lasting
2014-2016 El Niño August 31, 2015
Establishment of the strong and long-lasting
2014-2016 El Niño August 31, 2015
Слайд 42Arctic sea ice changes 2007-2017
Explained by the release of geothermal heat through
Arctic sea ice changes 2007-2017 Explained by the release of geothermal heat through
Слайд 43Arctic sea ice extent 2007-2016
Source: National Snow & Ice Data Centre
Record minimum
Gradual
Arctic sea ice extent 2007-2016
Source: National Snow & Ice Data Centre
Record minimum
Gradual
Слайд 44Influence on minimum Arctic sea ice extent
Winter 2014-2016
Summer 2014-2016
Source: NISDC.org
Influence on minimum Arctic sea ice extent
Winter 2014-2016
Summer 2014-2016
Source: NISDC.org
Слайд 45Ranking of Arctic monthly air temperatures 1979-2017
NOAA
Ranking of Arctic monthly air temperatures 1979-2017
NOAA
Слайд 46New submarine volcanic eruption
discovered in the Mozambique Channel
November 2018-May 2019
New submarine volcanic eruption
discovered in the Mozambique Channel
November 2018-May 2019
Слайд 47Multibeam sonar waves, reflecting off the sea floor
southeast Mayotte, showing an 800-m-tall
Multibeam sonar waves, reflecting off the sea floor southeast Mayotte, showing an 800-m-tall
Слайд 48Global map of sea-surface temperature anomalies on November 18, 2019
North
Pacific
Blob
Southwest
Indian Ocean
Global map of sea-surface temperature anomalies on November 18, 2019
North
Pacific
Blob
Southwest
Indian Ocean
Слайд 49Lateiki submarine eruption, Tonga
new island created November 7, 2019
Old island destroyed and
Lateiki submarine eruption, Tonga
new island created November 7, 2019
Old island destroyed and
Слайд 50Global map of sea-surface temperature anomalies on November 21, 2019
Lateiki
submarine
eruption,
Tonga
Global map of sea-surface temperature anomalies on November 21, 2019
Lateiki
submarine
eruption,
Tonga
Слайд 51Global map of sea-surface temperature anomalies on December 9, 2019
White
Island
eruption
Global map of sea-surface temperature anomalies on December 9, 2019
White
Island
eruption
Слайд 52Global map of sea-surface temperature anomalies on December 19, 2019
South
Pacific
Blob
Global map of sea-surface temperature anomalies on December 19, 2019
South
Pacific
Blob
Слайд 53Statistics of the South Pacific Blob
Marine heat wave east of New
Statistics of the South Pacific Blob
Marine heat wave east of New
Слайд 54Marine heatwave brings tropical grouper from
3000 km away to New Zealand waters
Marine heatwave brings tropical grouper from
3000 km away to New Zealand waters
Слайд 55Submarine volcanic eruptions contributing geothermal heat to the South Pacific Blob
Submarine volcanic eruptions contributing geothermal heat to the South Pacific Blob
Слайд 56Landsat images showing dramatic melting in the Eagle Island region of Antarctica
Landsat images showing dramatic melting in the Eagle Island region of Antarctica
Слайд 57Map derived from the Goddard Earth Observing System model representing air temperatures
Map derived from the Goddard Earth Observing System model representing air temperatures
 Применение основных свойств металлов в автомобильном транспорте
 Результаты диагностики учащихся 9 «В» класса лицея № 1557
 Спектральные методы. Спектрофотометрия и фотоколориметрия в анализе объектов окружающей среды
 Презентация на тему Что такое плотность вещества (исследовательская работа)?
  Странички истории
 Травма головы и спины
 Претенденты на зачисление в 1 класс
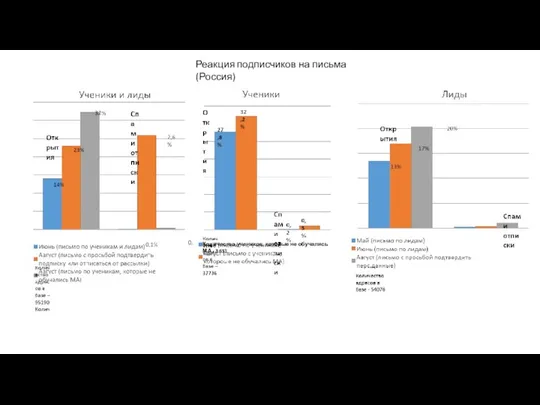 Отчет по рассылкам (с учетом августа)
 ИТОГИ РАБОТЫ ЭКСПЕРТНОЙ ГРУППЫ
 Буква Аа в открытом и закрытом слогах
 Боди-арт
 Мои достижения
 Реализм XVIII век
 Предлоги
 Хохлома
 Художественные стили начала ХХ века
 Презентация на тему Деепричастный оборот
 Трубопроводный транспорт
 Презентация
 KP Navigator, подарки для компании Росгорстрахбанк
 Аннимация
 Караульная служба. Обязанности и действия часового
 Презентация на тему Расчеты по химическим уравнениям
  Химическое оружие
  Знаешь ли ты Конституцию РФ
 Marking punctuation
 Профспілковий куточок. Шаблон
 Балалардың өсуі мен дамуының негіздері