- Population statistics

Содержание
- 2. Population: A group of organisms of the same species that live in a specific area. Species:
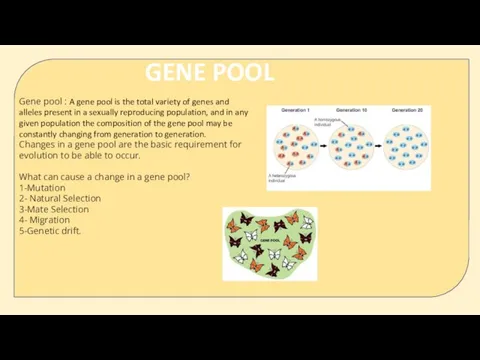
- 3. Gene pool : A gene pool is the total variety of genes and alleles present in
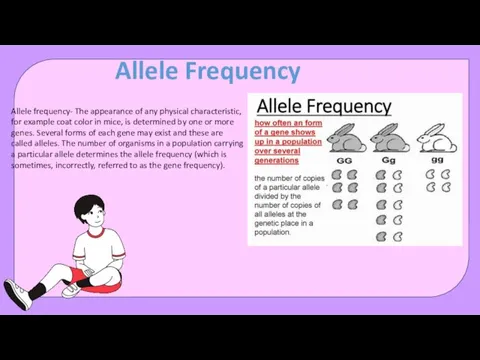
- 4. Allele frequency- The appearance of any physical characteristic, for example coat color in mice, is determined
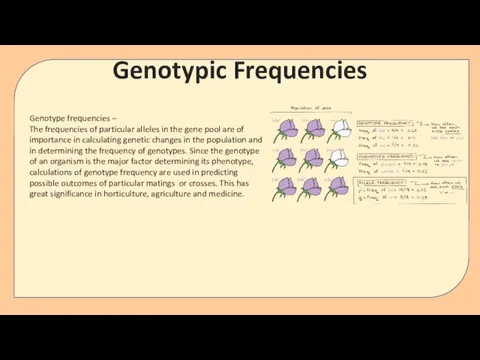
- 5. Genotype frequencies – The frequencies of particular alleles in the gene pool are of importance in
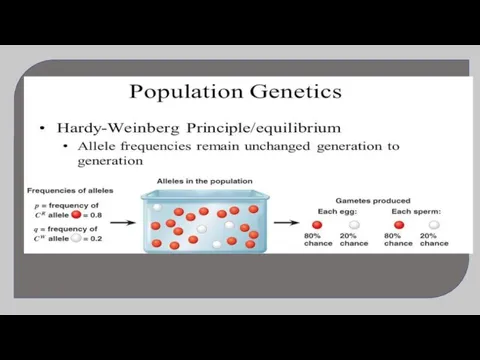
- 6. Scientists monitor frequency of the dominant and recessive allele in a population year after year. In
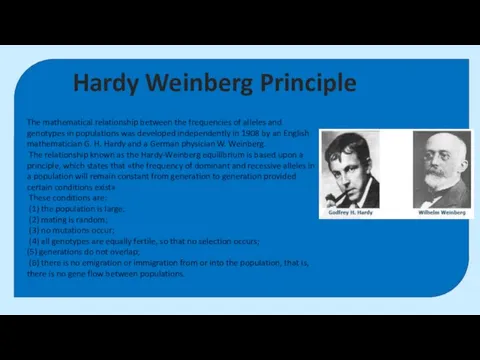
- 7. The mathematical relationship between the frequencies of alleles and genotypes in populations was developed independently in
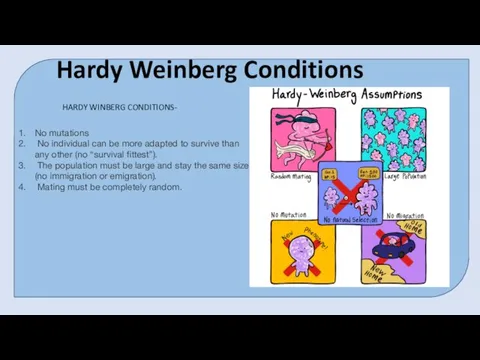
- 8. No mutations No individual can be more adapted to survive than any other (no “survival fittest”).
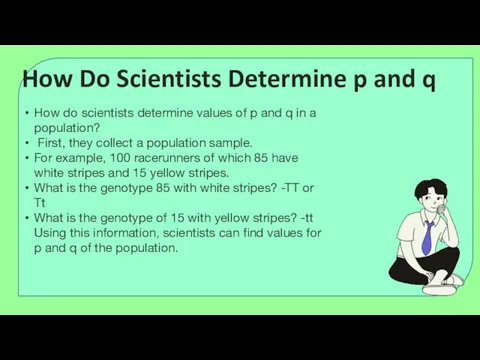
- 9. How do scientists determine values of p and q in a population? First, they collect a
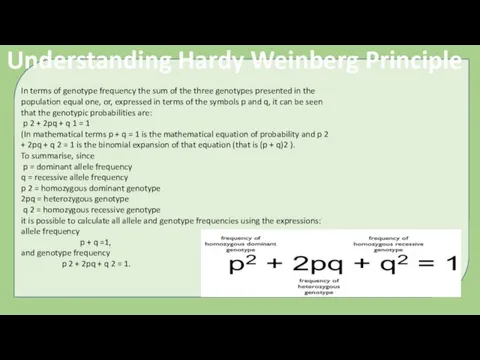
- 10. In terms of genotype frequency the sum of the three genotypes presented in the population equal
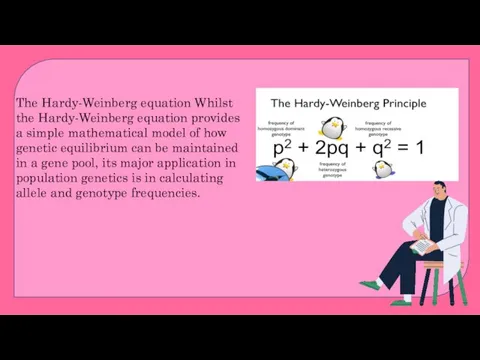
- 11. The Hardy-Weinberg equation Whilst the Hardy-Weinberg equation provides a simple mathematical model of how genetic equilibrium
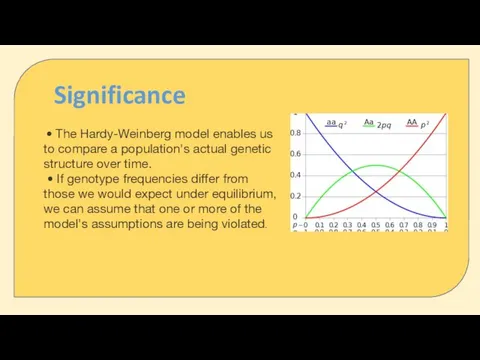
- 13. • The Hardy-Weinberg model enables us to compare a population's actual genetic structure over time. •
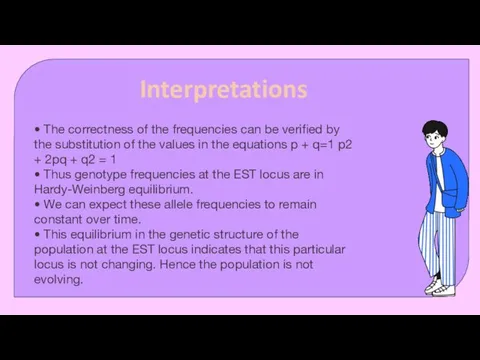
- 14. • The correctness of the frequencies can be verified by the substitution of the values in
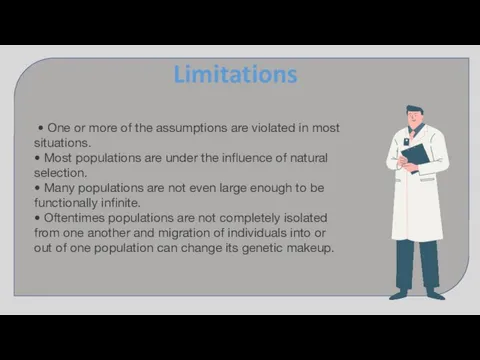
- 15. • One or more of the assumptions are violated in most situations. • Most populations are
- 17. Скачать презентацию
Слайд 3Gene pool : A gene pool is the total variety of genes
Gene pool : A gene pool is the total variety of genes
Слайд 4Allele frequency- The appearance of any physical characteristic, for example coat color
Allele frequency- The appearance of any physical characteristic, for example coat color
Слайд 5Genotype frequencies –
The frequencies of particular alleles in the gene pool are
Genotype frequencies –
The frequencies of particular alleles in the gene pool are
Слайд 6Scientists monitor frequency of the dominant and recessive allele in a population
Scientists monitor frequency of the dominant and recessive allele in a population
Слайд 7The mathematical relationship between the frequencies of alleles and genotypes in populations
The mathematical relationship between the frequencies of alleles and genotypes in populations
Слайд 8No mutations
No individual can be more adapted to survive than any
No mutations
No individual can be more adapted to survive than any
Слайд 9How do scientists determine values of p and q in a population?
How do scientists determine values of p and q in a population?
Слайд 10In terms of genotype frequency the sum of the three genotypes presented
In terms of genotype frequency the sum of the three genotypes presented
Слайд 11The Hardy-Weinberg equation Whilst the Hardy-Weinberg equation provides a simple mathematical model
The Hardy-Weinberg equation Whilst the Hardy-Weinberg equation provides a simple mathematical model
Слайд 13 • The Hardy-Weinberg model enables us to compare a population's actual genetic
• The Hardy-Weinberg model enables us to compare a population's actual genetic
Слайд 14• The correctness of the frequencies can be verified by the substitution
• The correctness of the frequencies can be verified by the substitution
Слайд 15 • One or more of the assumptions are violated in most situations.
• One or more of the assumptions are violated in most situations.
 Бонсай
 Предпосылки возникновения дарвинизма
 Презентация на тему Семейства Крестоцветные и Паслёновые растения
  Древлянский природный заповедник
 Внешнее строение млекопитающих
 Проращивание лука (опыт)
 Презентация на тему Мхи и папоротники (5 класс)
  Побег. Строение побега
 Изучение строения растительной и животной клеток под микроскопом Лабораторная работа
 Генетика - бүкіл тірі ағзаларға тән тұқым қуалаушылық пен өзгергіштікті зерттейтін биология ғылымының бір саласы
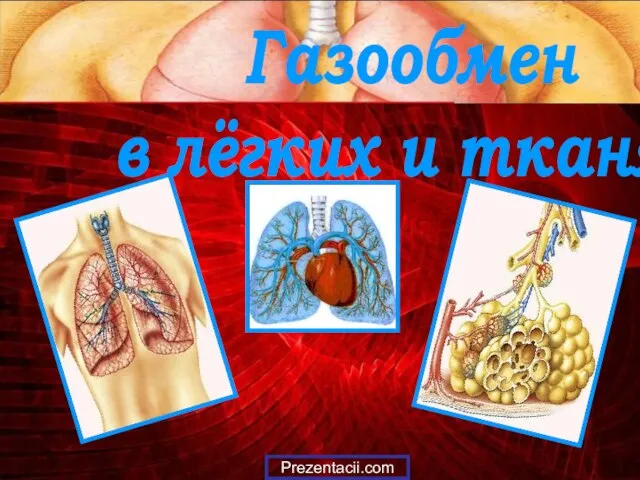 Презентация на тему Газообмен в лёгких и тканях
  Презентация на тему Организм и его свойства
  Barnyard dash
 Птичий двор. Самые быстрые птицы мира
 Способы деления клеток: амитоз, митоз и мейоз
 Тип плоские черви. Класс сосальщики
 Размножение грибов
 Биологическое влияние радиоактивных излучений
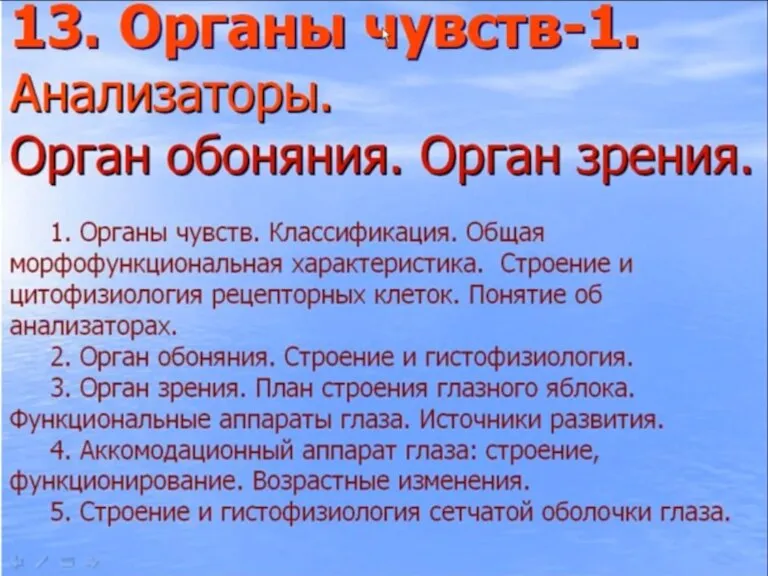 Органы чувств -1. Анализаторы. Орган обоняния. Орган зрения
 Кора больших полушарий мозга
 Морковь
 Lektsia_2
 Силы в природе
 Mochepolovaya
 Межклеточные взаимодействия через кадгерины
 Спинной мозг
 Биология. Нуклеиновые Кислоты
 2. Урок - .ДНК