- Power BI Introduction to Power BI

Содержание
- 2. Hello, my name is Kristina
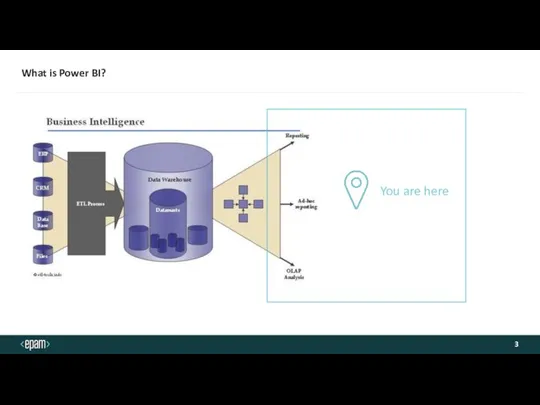
- 3. What is Power BI? You are here
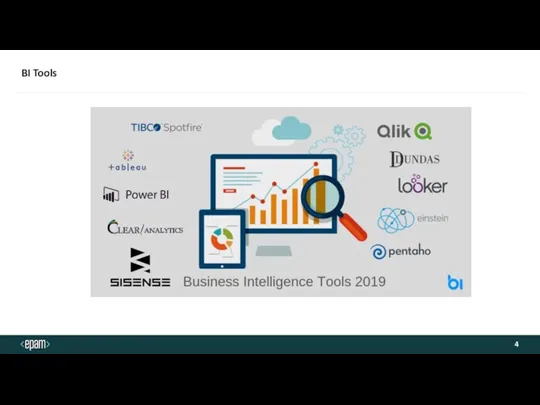
- 4. BI Tools
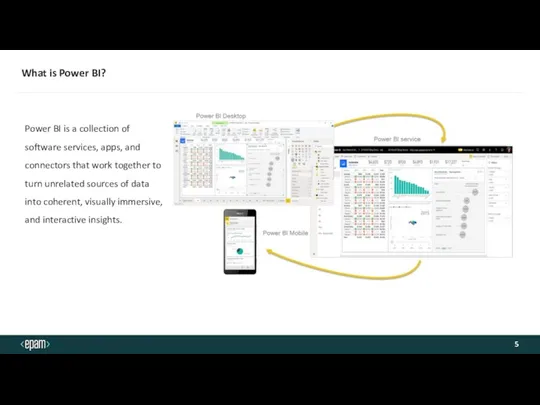
- 5. What is Power BI? Power BI is a collection of software services, apps, and connectors that
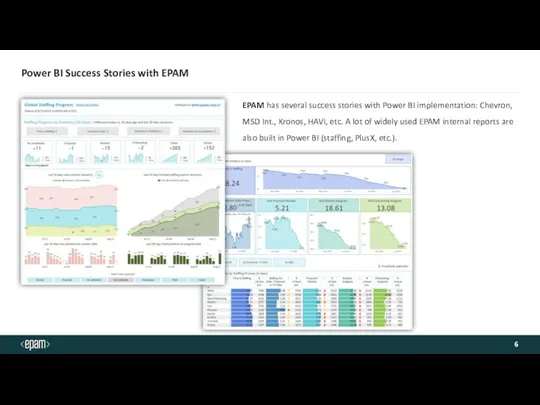
- 6. Power BI Success Stories with EPAM EPAM has several success stories with Power BI implementation: Chevron,
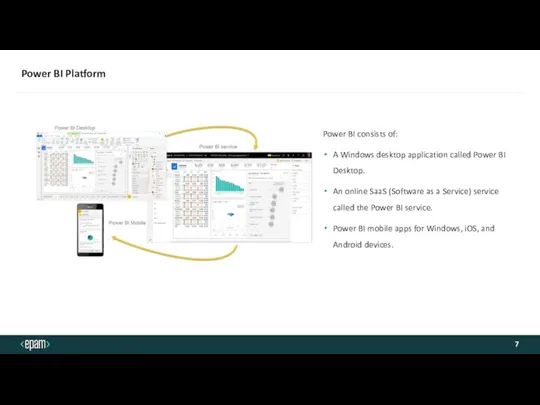
- 7. Power BI Platform Power BI consists of: A Windows desktop application called Power BI Desktop. An
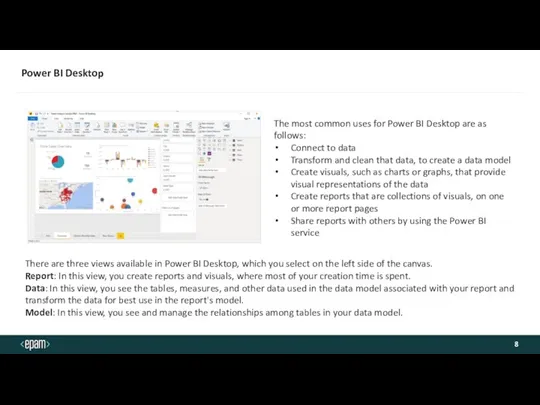
- 8. There are three views available in Power BI Desktop, which you select on the left side
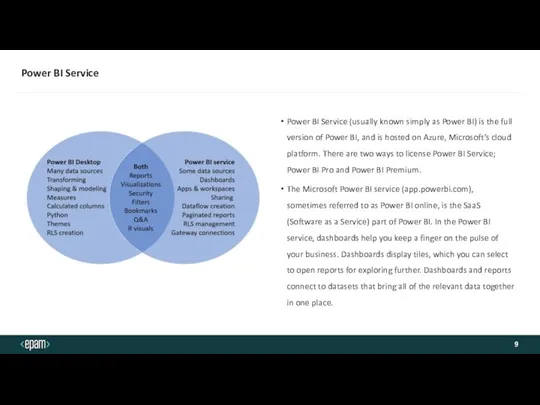
- 9. Power BI Service Power BI Service (usually known simply as Power BI) is the full version
- 10. Other Products Power BI Mobile Power BI reports and dashboards are available in the Power BI
- 11. Azure Gateway The on-premises data gateway acts as a bridge to provide quick and secure data
- 12. Power BI Components The Power BI product is made up of a number of apps, each
- 13. Power Query Power Query is data transformation and mash up engine. Power Query can be downloaded
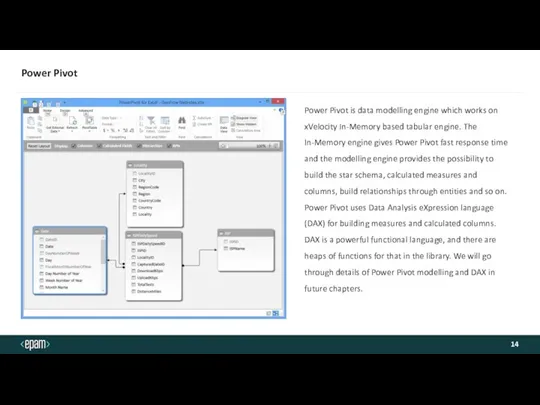
- 14. Power Pivot Power Pivot is data modelling engine which works on xVelocity In-Memory based tabular engine.
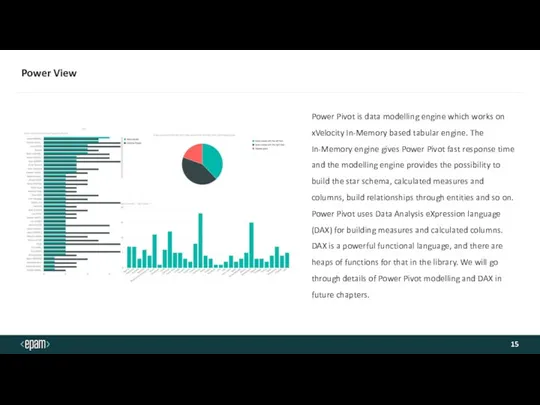
- 15. Power View Power Pivot is data modelling engine which works on xVelocity In-Memory based tabular engine.
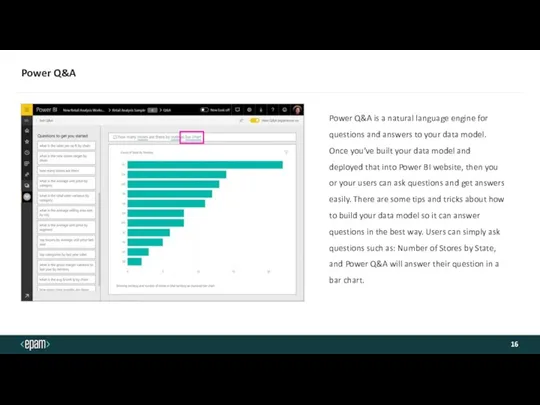
- 16. Power Q&A Power Q&A is a natural language engine for questions and answers to your data
- 17. Homework PBIX file with your progress Word/Power Point file with screenshots and comments * Additional steps
- 19. Скачать презентацию
Слайд 3What is Power BI?
You are here
What is Power BI?
You are here
Слайд 4BI Tools
BI Tools
Слайд 5What is Power BI?
Power BI is a collection of software services, apps,
What is Power BI?
Power BI is a collection of software services, apps,
Слайд 6Power BI Success Stories with EPAM
EPAM has several success stories with Power
Power BI Success Stories with EPAM
EPAM has several success stories with Power
Слайд 7Power BI Platform
Power BI consists of:
A Windows desktop application called Power BI
Power BI Platform
Power BI consists of:
A Windows desktop application called Power BI
Слайд 8There are three views available in Power BI Desktop, which you select
There are three views available in Power BI Desktop, which you select
Слайд 9Power BI Service
Power BI Service (usually known simply as Power BI) is
Power BI Service
Power BI Service (usually known simply as Power BI) is
Слайд 10Other Products
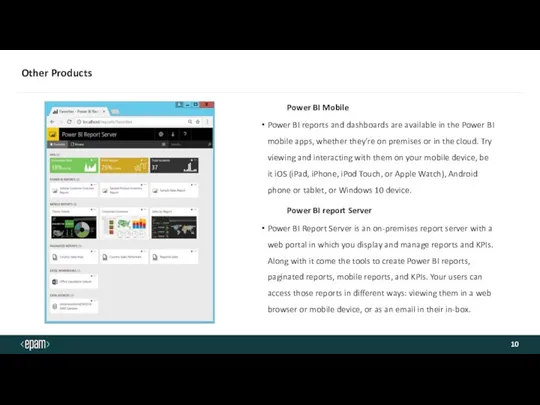
Power BI Mobile
Power BI reports and dashboards are available in the
Other Products
Power BI Mobile
Power BI reports and dashboards are available in the
Слайд 11Azure Gateway
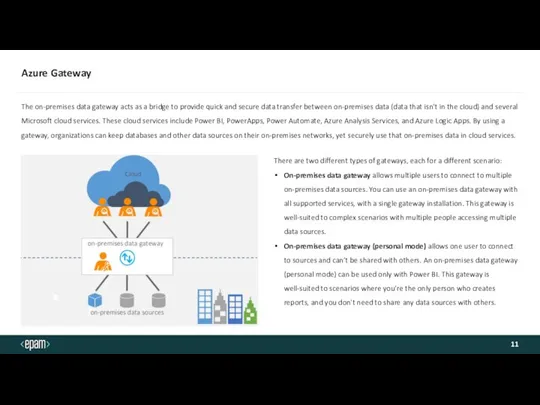
The on-premises data gateway acts as a bridge to provide quick
Azure Gateway
The on-premises data gateway acts as a bridge to provide quick
Слайд 12Power BI Components
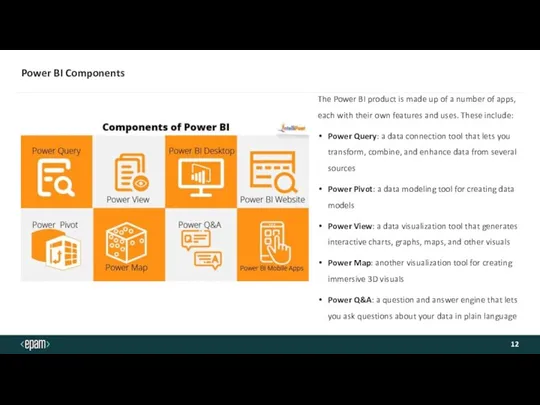
The Power BI product is made up of a number
Power BI Components
The Power BI product is made up of a number
Слайд 13Power Query
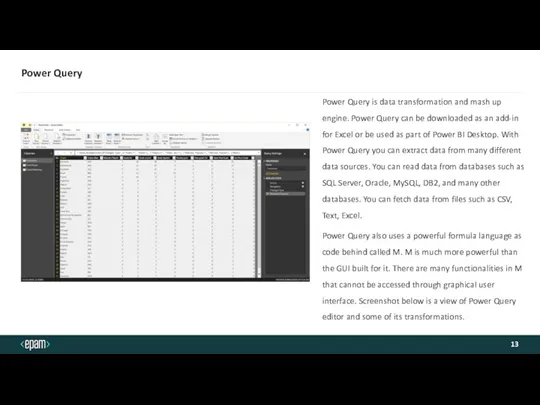
Power Query is data transformation and mash up engine. Power Query
Power Query
Power Query is data transformation and mash up engine. Power Query
Слайд 14Power Pivot
Power Pivot is data modelling engine which works on xVelocity In-Memory
Power Pivot
Power Pivot is data modelling engine which works on xVelocity In-Memory
Слайд 15Power View
Power Pivot is data modelling engine which works on xVelocity In-Memory
Power View
Power Pivot is data modelling engine which works on xVelocity In-Memory
Слайд 16Power Q&A
Power Q&A is a natural language engine for questions and answers
Power Q&A
Power Q&A is a natural language engine for questions and answers
Слайд 17Homework
PBIX file with your progress
Word/Power Point file with screenshots and comments
* Additional
Homework
PBIX file with your progress
Word/Power Point file with screenshots and comments
* Additional
 Мировой опыт: indoor-медианосители, которые можно адаптировать в РФ
 Проведение информационноразъяснительной медиа кампании о деятельности национального превентивного механизма
 Реализация стрельбы в играх
 Знакомство с интерфейсом
 Представление о технических и программных средствах телекоммуникационных технологий
 Как сохранить созданный рисунок. Как открыть сохранённый на диске рисунок
 Информационно-аналитическая система SCIENCE INDEX для авторов. Научная электронная библиотека eLIBRARY.RU
 Эволюция компьютерного вируса
 Время, потерянное с удовольствием, не считается потерянным
 Чат помощи для молодых мам
 Интерфаол технологиялар. Таҳлил қиладиган технологиялар
 Технологии программирования. Составные части объектного подхода
 Подсистемы САПР и их классификация
 Адаптивность страниц в веб-разработке и проблемы реализации навигации
 Основные защитные механизмы, реализуемые в рамках различных мер и средств защиты
 Разработка баз данных
 Gambling в 2018
 Онлайн кассы 2018
 Сервисы Арбикон. Форма библиотечного обслуживания
 Аппаратное обеспечение ПК
 Декларация независимости Киберпространства
 Платформа для цифрового моделирования. Система технического документооборота Vitro-CAD
 Замечания по диаграммам IDEF0
 Алгоритмы. Значение алгоритма в информатике
 Онлайн-образование. DDT
 Как ставить статусы в зен?
 Отчет об научно-исследовательской работе
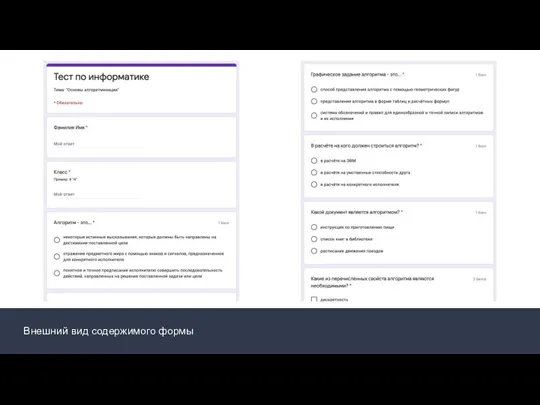 Внешний вид содержимого формы