- Basic Concepts of Real Estate Marketability Analysis

Содержание
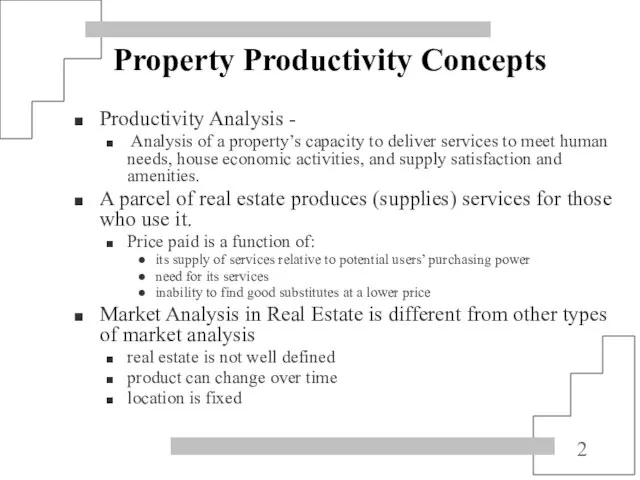
- 2. Property Productivity Concepts Productivity Analysis - Analysis of a property’s capacity to deliver services to meet
- 3. Property Productivity Concepts Focus of the discussion for all aspects of the subject property is to:
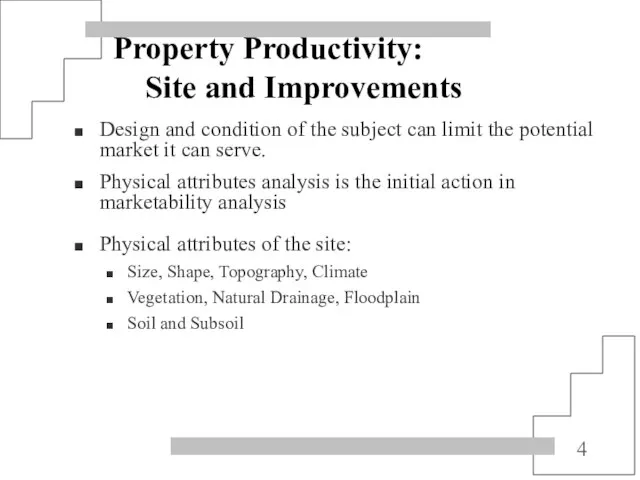
- 4. Property Productivity: Site and Improvements Design and condition of the subject can limit the potential market
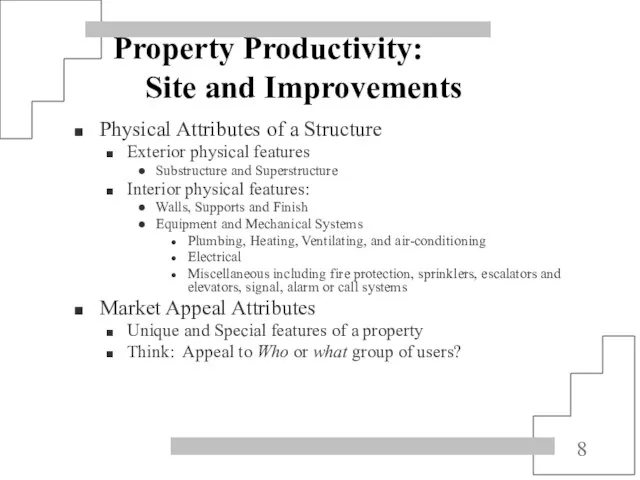
- 8. Property Productivity: Site and Improvements Physical Attributes of a Structure Exterior physical features Substructure and Superstructure
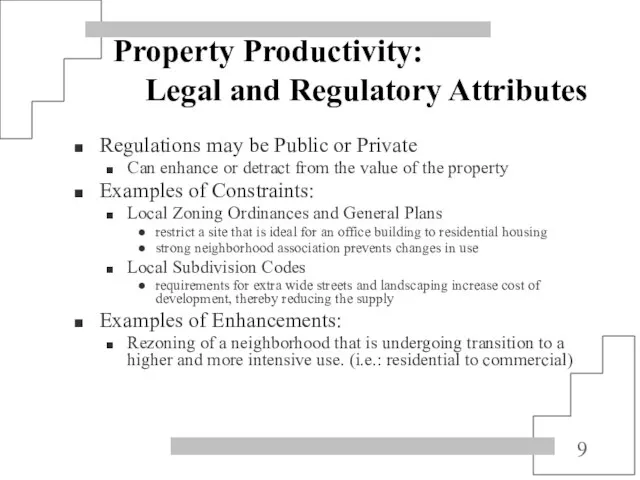
- 9. Property Productivity: Legal and Regulatory Attributes Regulations may be Public or Private Can enhance or detract
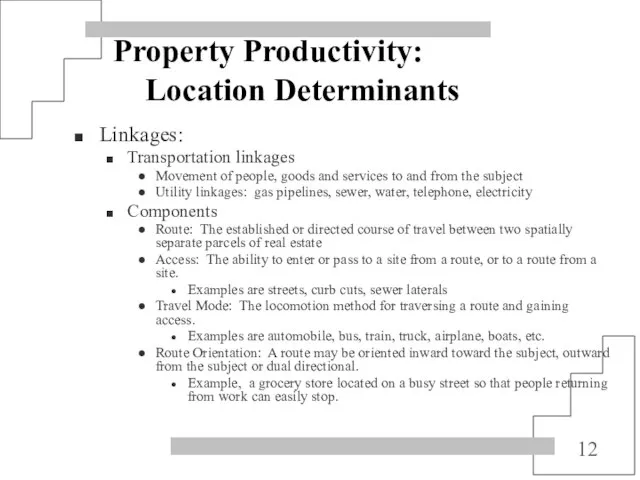
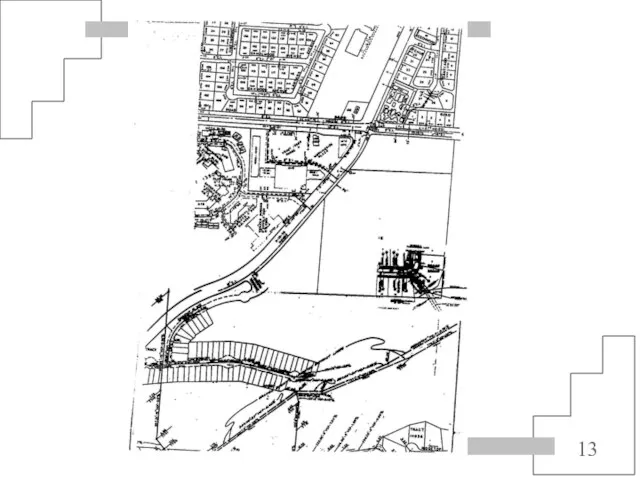
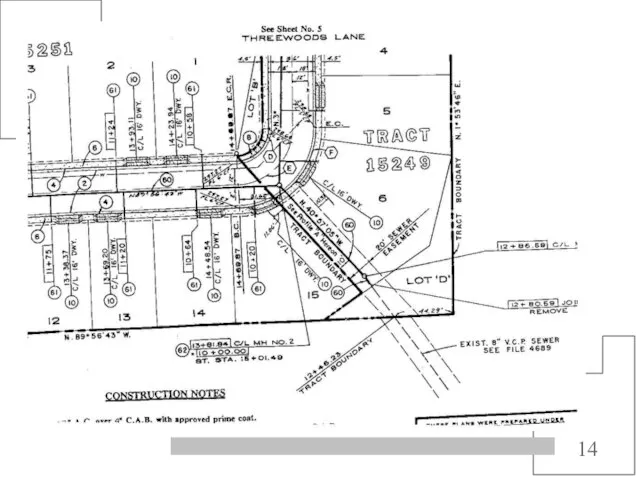
- 12. Property Productivity: Location Determinants Linkages: Transportation linkages Movement of people, goods and services to and from
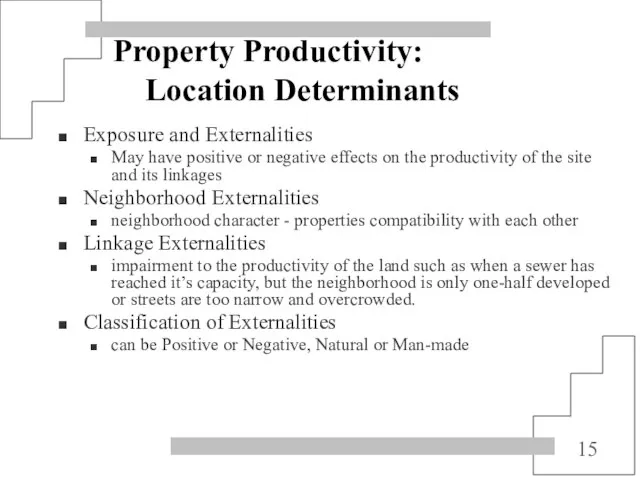
- 15. Property Productivity: Location Determinants Exposure and Externalities May have positive or negative effects on the productivity
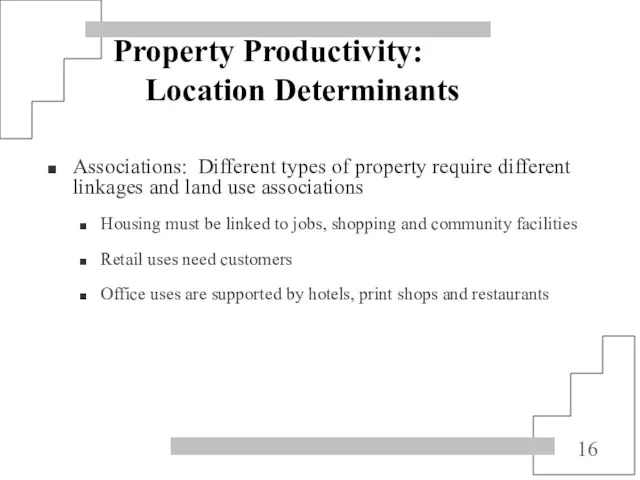
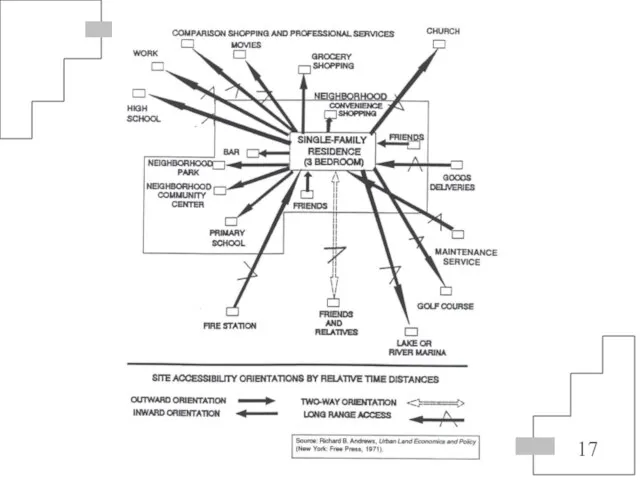
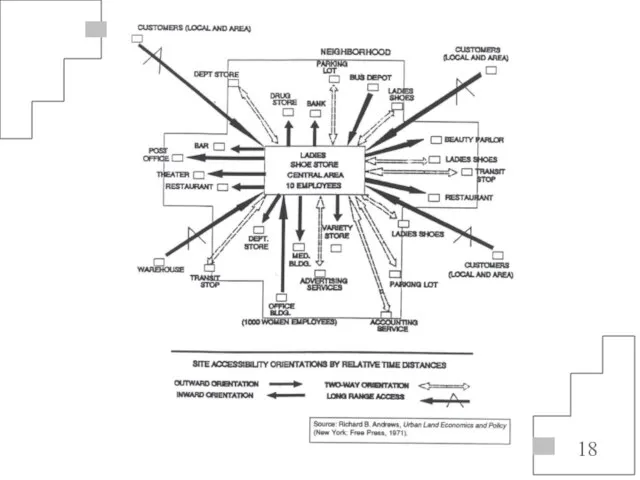
- 16. Property Productivity: Location Determinants Associations: Different types of property require different linkages and land use associations
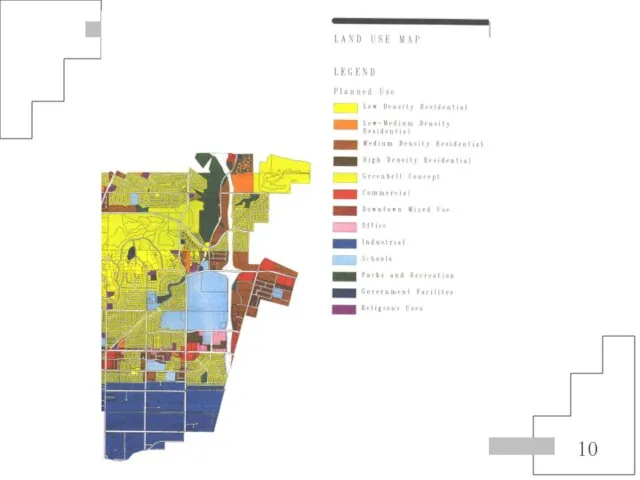
- 20. Property Productivity: Location Determinants Situs Analysis as a Land Use Predictor Definition: The total urban environment
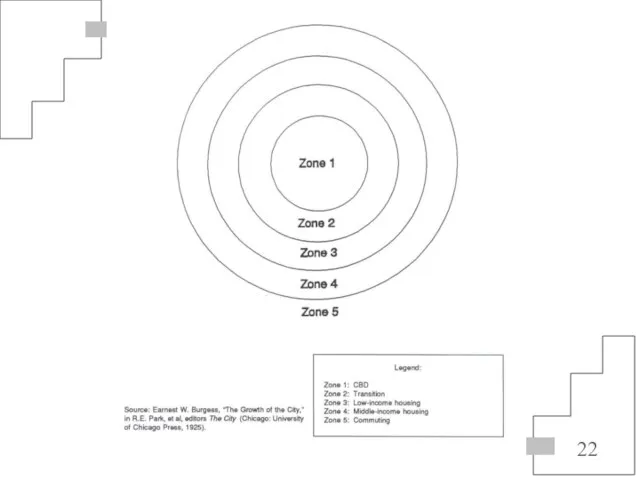
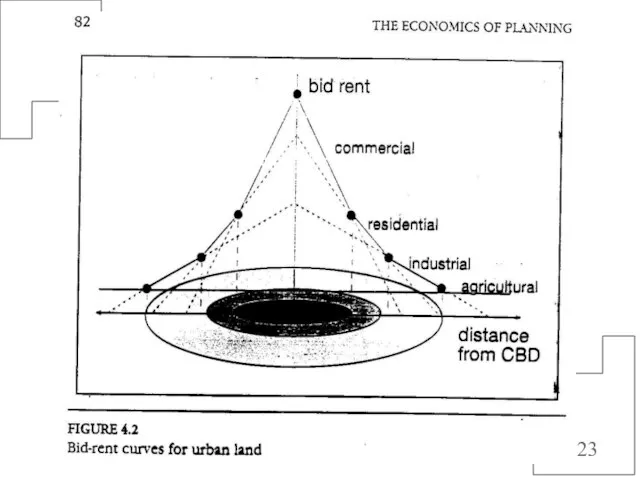
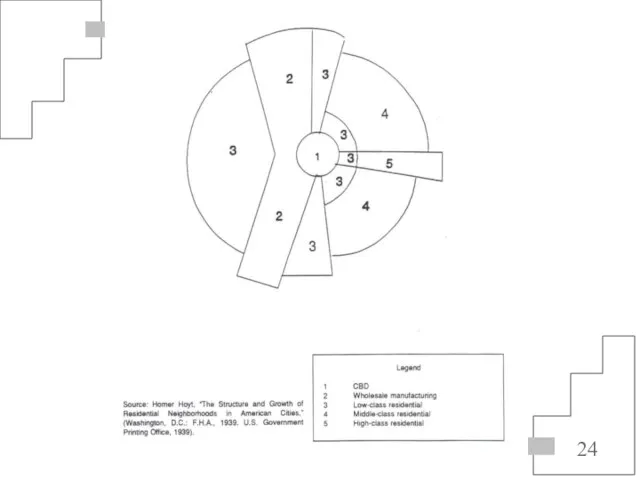
- 21. Urban Growth Structure Analysis Theories of Urban Growth Concentric Zone Structure Presumes five concentric zones that
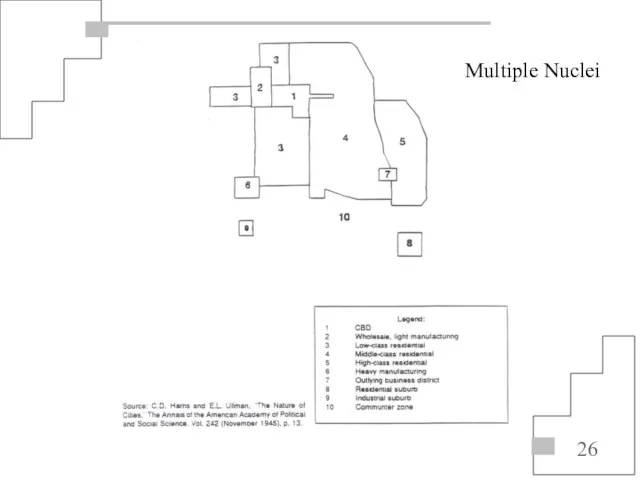
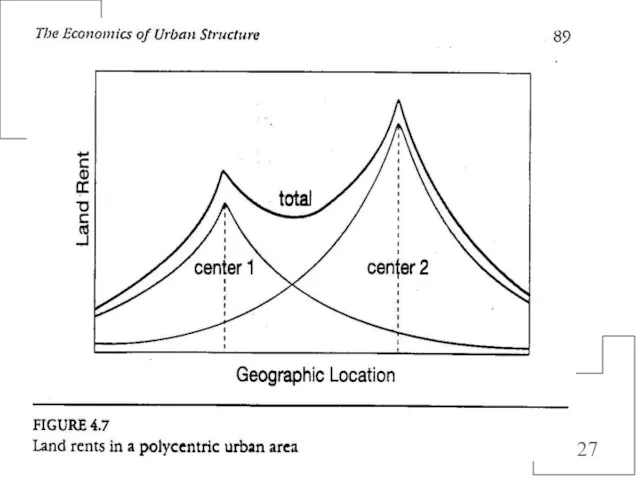
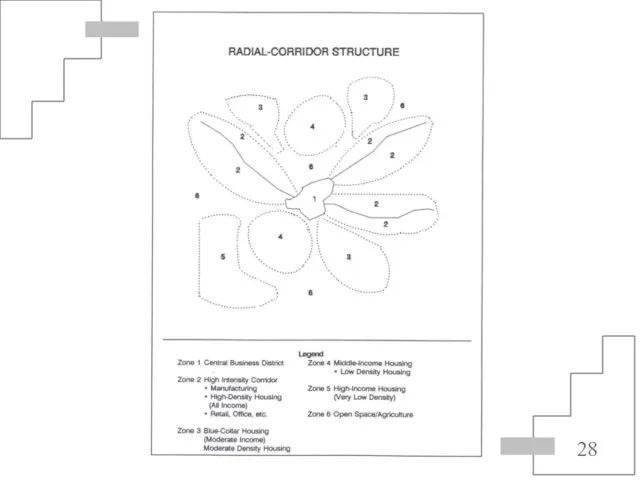
- 25. Urban Growth Structure Analysis Theories of Urban Growth Multi-nuclei Structure Basic premise is that an urban
- 26. Multiple Nuclei
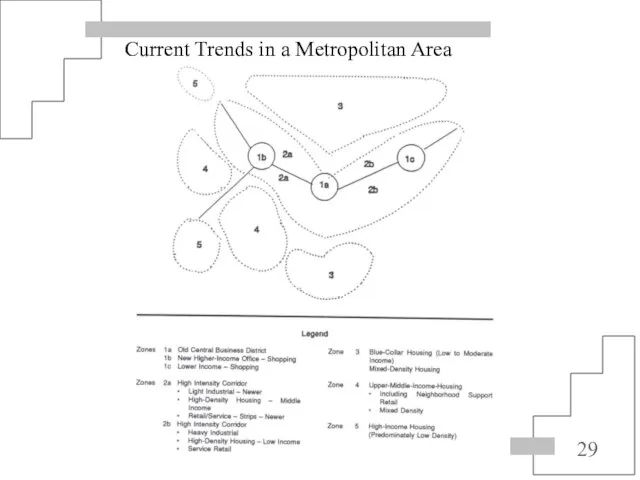
- 29. Current Trends in a Metropolitan Area
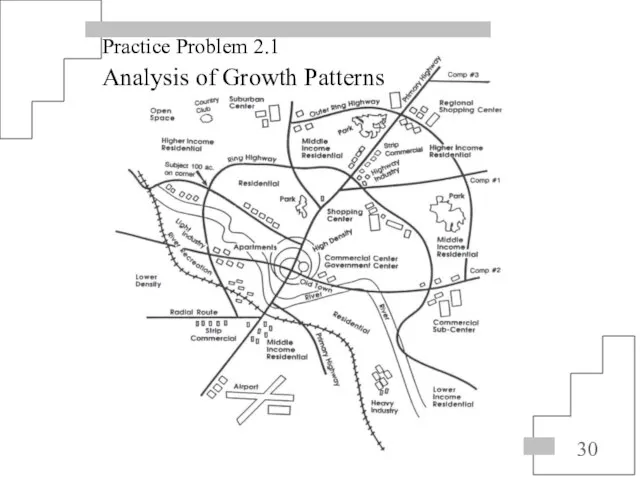
- 30. Practice Problem 2.1 Analysis of Growth Patterns
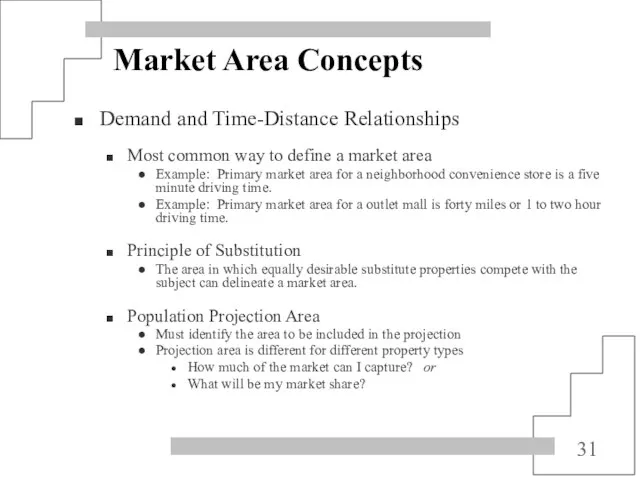
- 31. Market Area Concepts Demand and Time-Distance Relationships Most common way to define a market area Example:
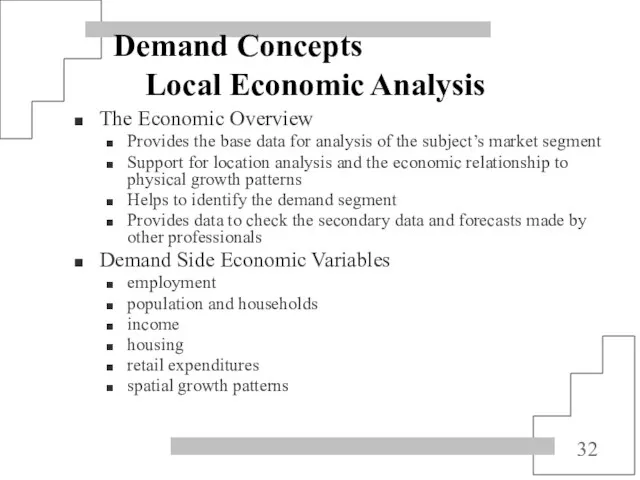
- 32. Demand Concepts Local Economic Analysis The Economic Overview Provides the base data for analysis of the
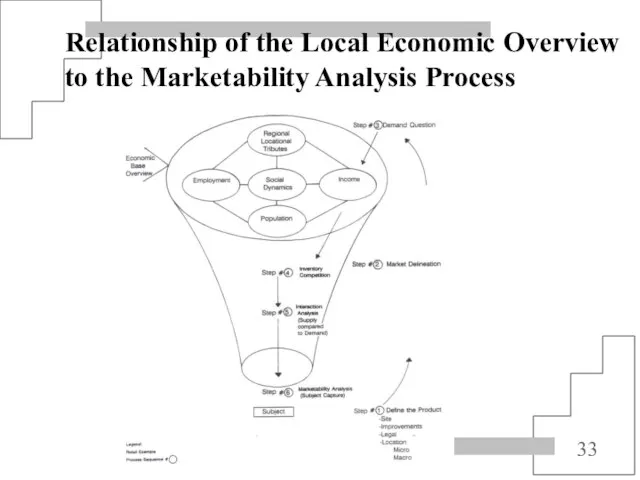
- 33. Relationship of the Local Economic Overview to the Marketability Analysis Process
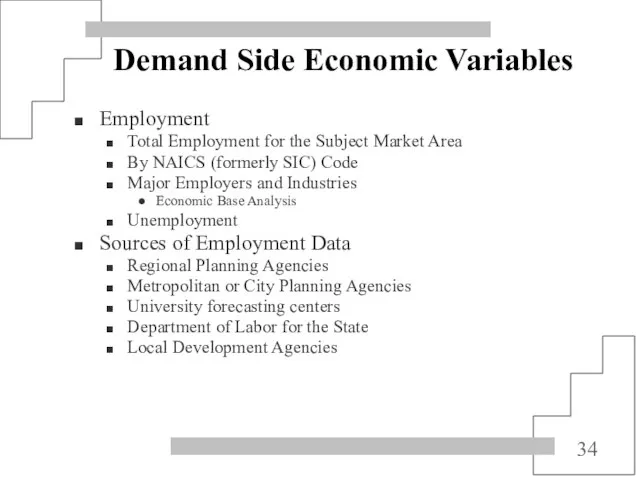
- 34. Demand Side Economic Variables Employment Total Employment for the Subject Market Area By NAICS (formerly SIC)
- 36. Demand Side Economic Variables Population and Households Population and Number of households and families, population in
- 38. Demand Side Economic Variables Income Mean, Median and per Capita Income Income Distribution Data to Gather
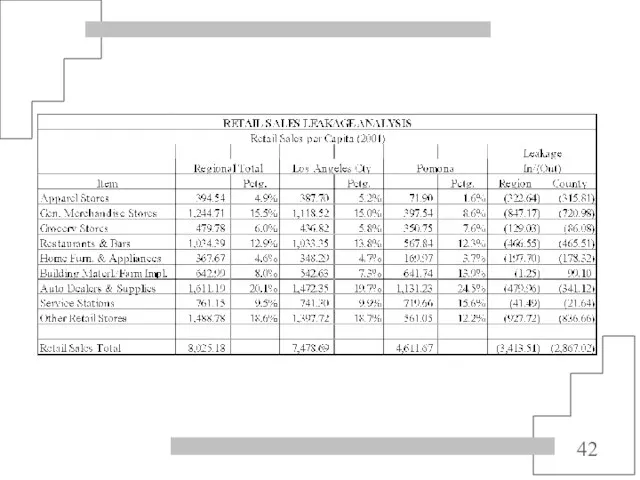
- 39. Demand Side Economic Variables Retail Expenditures The retail SIC Codes (generally codes 44) Characteristics of and
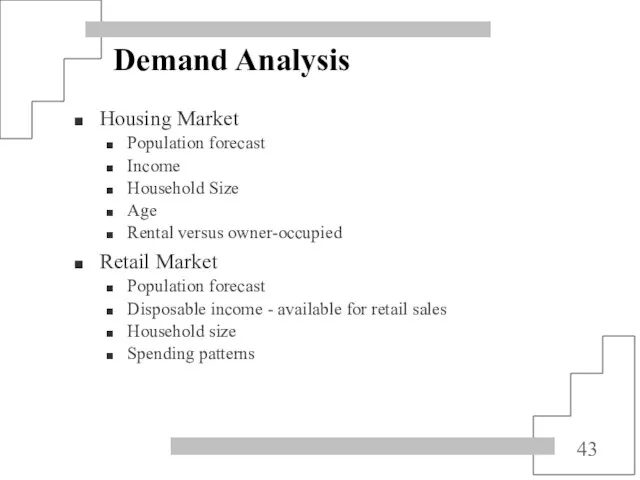
- 43. Demand Analysis Housing Market Population forecast Income Household Size Age Rental versus owner-occupied Retail Market Population
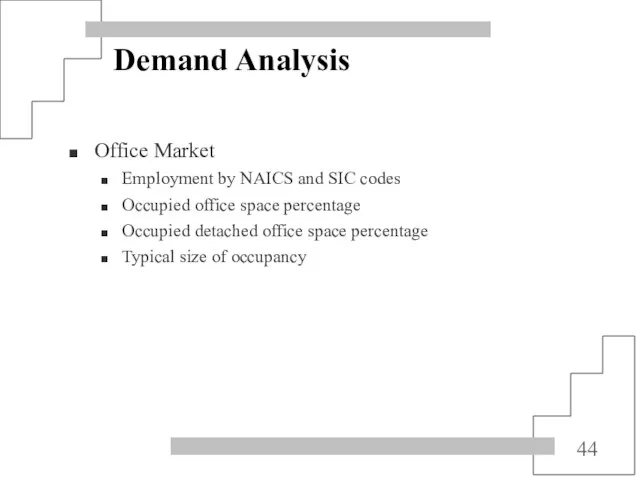
- 44. Demand Analysis Office Market Employment by NAICS and SIC codes Occupied office space percentage Occupied detached
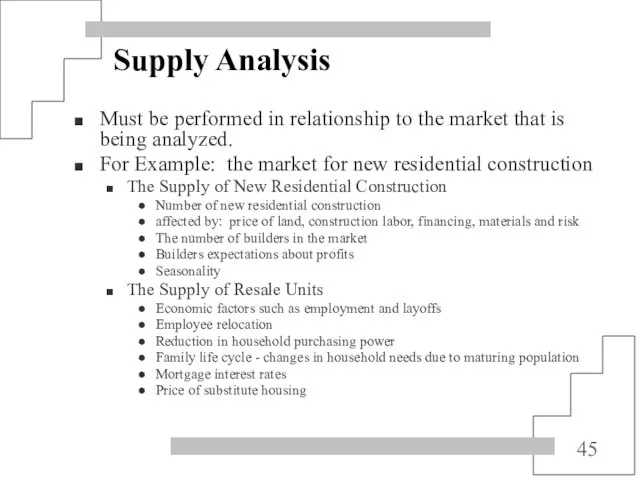
- 45. Supply Analysis Must be performed in relationship to the market that is being analyzed. For Example:
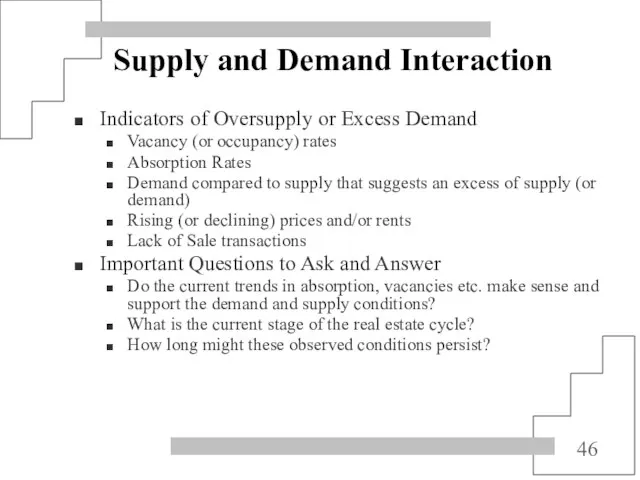
- 46. Supply and Demand Interaction Indicators of Oversupply or Excess Demand Vacancy (or occupancy) rates Absorption Rates
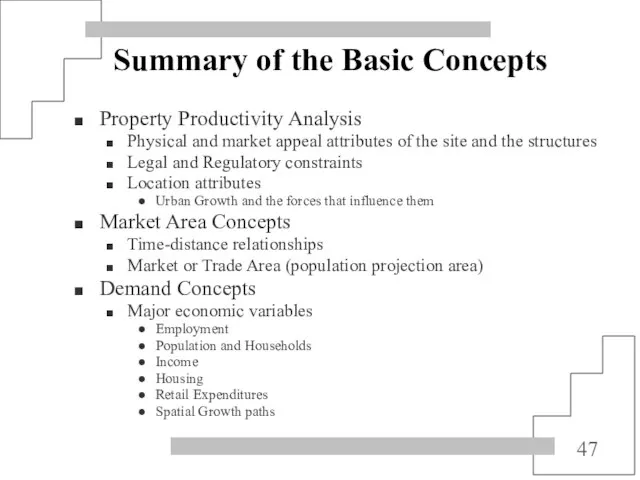
- 47. Summary of the Basic Concepts Property Productivity Analysis Physical and market appeal attributes of the site
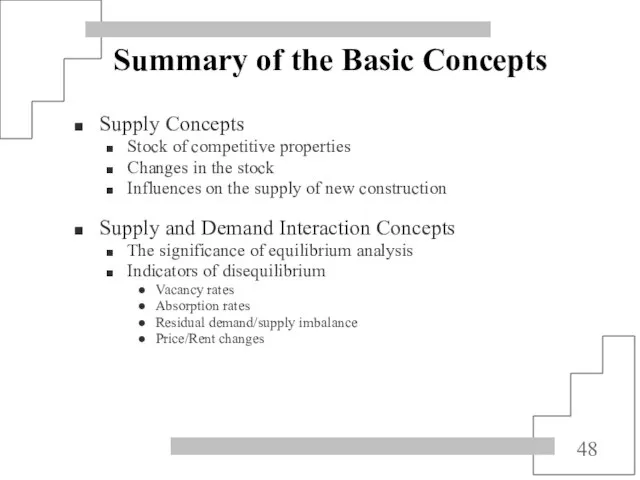
- 48. Summary of the Basic Concepts Supply Concepts Stock of competitive properties Changes in the stock Influences
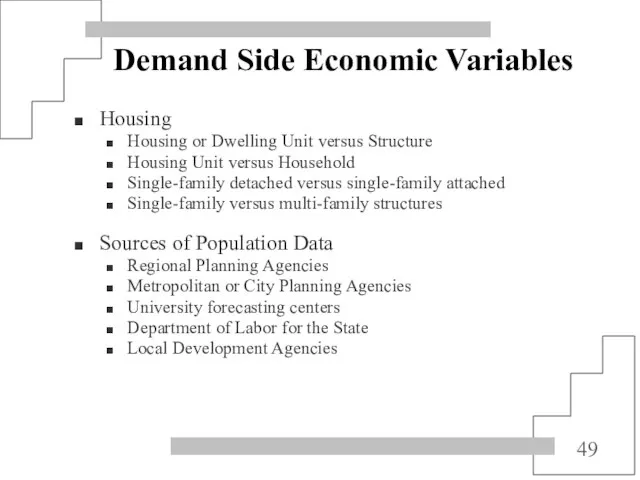
- 49. Demand Side Economic Variables Housing Housing or Dwelling Unit versus Structure Housing Unit versus Household Single-family
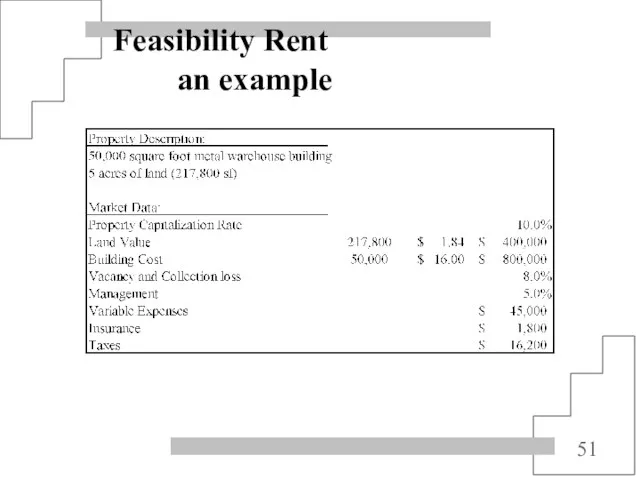
- 50. Feasibility Rent Definition: The rent (income) required to attract new construction for a specific property type.
- 51. Feasibility Rent an example
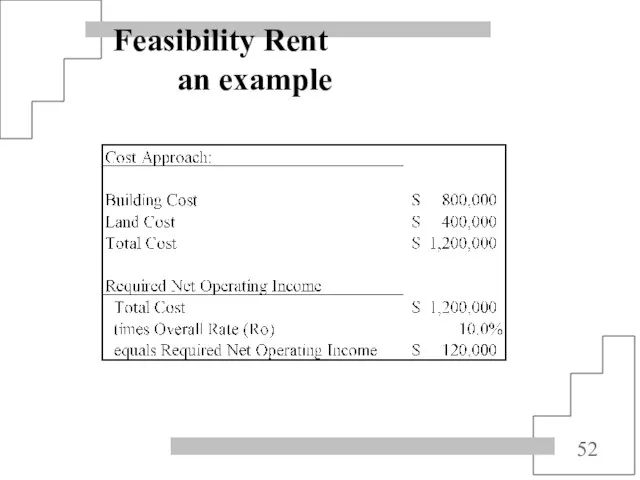
- 52. Feasibility Rent an example
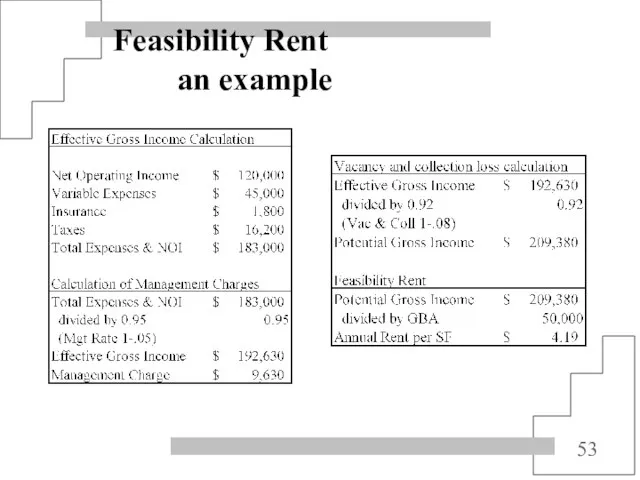
- 53. Feasibility Rent an example
- 55. Скачать презентацию
Слайд 2Property Productivity Concepts
Productivity Analysis -
Analysis of a property’s capacity to deliver
Property Productivity Concepts
Productivity Analysis -
Analysis of a property’s capacity to deliver
Слайд 3Property Productivity Concepts
Focus of the discussion for all aspects of the subject
Property Productivity Concepts
Focus of the discussion for all aspects of the subject

Слайд 4Property Productivity:
Site and Improvements
Design and condition of the subject can limit the
Property Productivity:
Site and Improvements
Design and condition of the subject can limit the
Слайд 8Property Productivity:
Site and Improvements
Physical Attributes of a Structure
Exterior physical features
Substructure and Superstructure
Interior
Property Productivity:
Site and Improvements
Physical Attributes of a Structure
Exterior physical features
Substructure and Superstructure
Interior
Слайд 9Property Productivity:
Legal and Regulatory Attributes
Regulations may be Public or Private
Can enhance
Property Productivity:
Legal and Regulatory Attributes
Regulations may be Public or Private
Can enhance
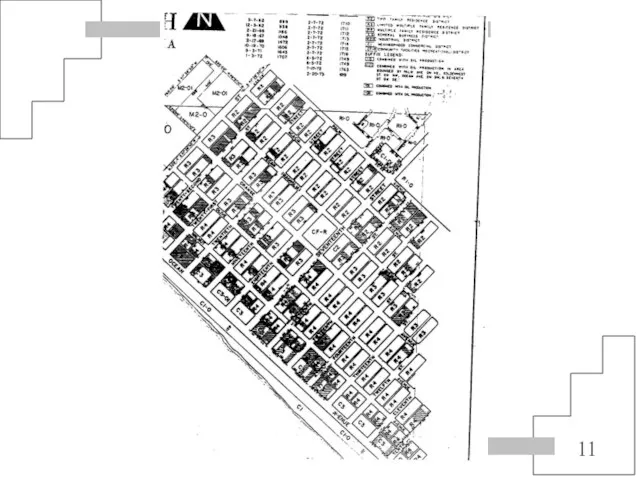
Слайд 12Property Productivity:
Location Determinants
Linkages:
Transportation linkages
Movement of people, goods and services to and
Property Productivity:
Location Determinants
Linkages:
Transportation linkages
Movement of people, goods and services to and
Слайд 15Property Productivity:
Location Determinants
Exposure and Externalities
May have positive or negative effects on
Property Productivity:
Location Determinants
Exposure and Externalities
May have positive or negative effects on
Слайд 16Property Productivity:
Location Determinants
Associations: Different types of property require different linkages and
Property Productivity:
Location Determinants
Associations: Different types of property require different linkages and
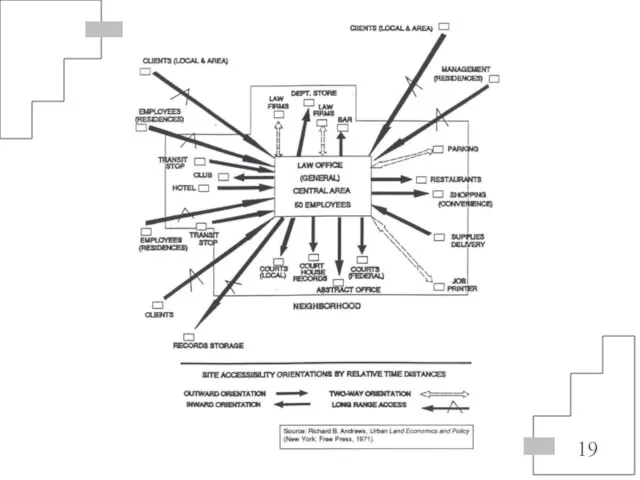
Слайд 20Property Productivity:
Location Determinants
Situs Analysis as a Land Use Predictor
Definition: The total
Property Productivity:
Location Determinants
Situs Analysis as a Land Use Predictor
Definition: The total
Слайд 21Urban Growth Structure Analysis
Theories of Urban Growth
Concentric Zone Structure
Presumes five concentric zones
Urban Growth Structure Analysis
Theories of Urban Growth
Concentric Zone Structure
Presumes five concentric zones
Слайд 25Urban Growth Structure Analysis
Theories of Urban Growth
Multi-nuclei Structure
Basic premise is that an
Urban Growth Structure Analysis
Theories of Urban Growth
Multi-nuclei Structure
Basic premise is that an

Слайд 26Multiple Nuclei
Multiple Nuclei
Слайд 29Current Trends in a Metropolitan Area
Current Trends in a Metropolitan Area
Слайд 30Practice Problem 2.1
Analysis of Growth Patterns
Practice Problem 2.1
Analysis of Growth Patterns
Слайд 31Market Area Concepts
Demand and Time-Distance Relationships
Most common way to define a market
Market Area Concepts
Demand and Time-Distance Relationships
Most common way to define a market
Слайд 32Demand Concepts
Local Economic Analysis
The Economic Overview
Provides the base data for analysis of
Demand Concepts
Local Economic Analysis
The Economic Overview
Provides the base data for analysis of
Слайд 33Relationship of the Local Economic Overview to the Marketability Analysis Process
Relationship of the Local Economic Overview to the Marketability Analysis Process
Слайд 34Demand Side Economic Variables
Employment
Total Employment for the Subject Market Area
By NAICS (formerly
Demand Side Economic Variables
Employment
Total Employment for the Subject Market Area
By NAICS (formerly
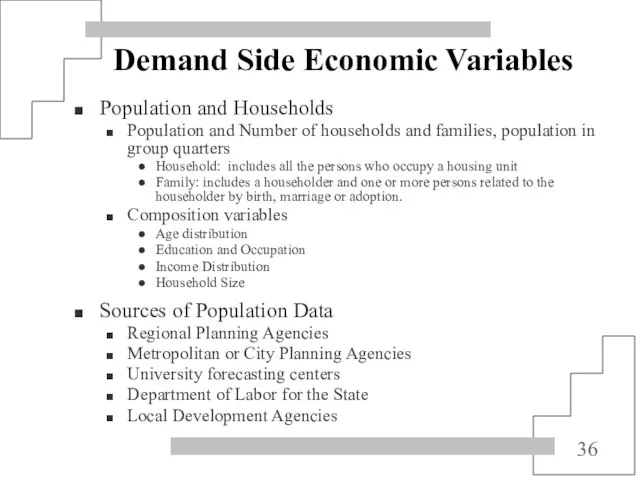
Слайд 36Demand Side Economic Variables
Population and Households
Population and Number of households and families,
Demand Side Economic Variables
Population and Households
Population and Number of households and families,
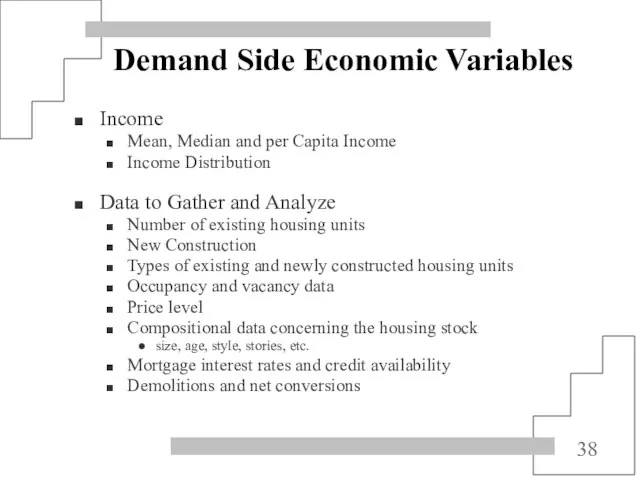
Слайд 38Demand Side Economic Variables
Income
Mean, Median and per Capita Income
Income Distribution
Data to Gather
Demand Side Economic Variables
Income
Mean, Median and per Capita Income
Income Distribution
Data to Gather
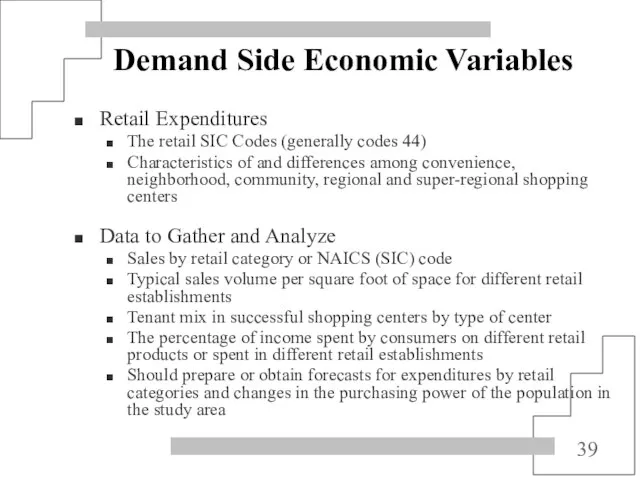
Слайд 39Demand Side Economic Variables
Retail Expenditures
The retail SIC Codes (generally codes 44)
Characteristics of
Demand Side Economic Variables
Retail Expenditures
The retail SIC Codes (generally codes 44)
Characteristics of

Слайд 43Demand Analysis
Housing Market
Population forecast
Income
Household Size
Age
Rental versus owner-occupied
Retail Market
Population forecast
Disposable income - available
Demand Analysis
Housing Market
Population forecast
Income
Household Size
Age
Rental versus owner-occupied
Retail Market
Population forecast
Disposable income - available
Слайд 44Demand Analysis
Office Market
Employment by NAICS and SIC codes
Occupied office space percentage
Occupied detached
Demand Analysis
Office Market
Employment by NAICS and SIC codes
Occupied office space percentage
Occupied detached
Слайд 45Supply Analysis
Must be performed in relationship to the market that is being
Supply Analysis
Must be performed in relationship to the market that is being
Слайд 46Supply and Demand Interaction
Indicators of Oversupply or Excess Demand
Vacancy (or occupancy) rates
Absorption
Supply and Demand Interaction
Indicators of Oversupply or Excess Demand
Vacancy (or occupancy) rates
Absorption
Слайд 47Summary of the Basic Concepts
Property Productivity Analysis
Physical and market appeal attributes of
Summary of the Basic Concepts
Property Productivity Analysis
Physical and market appeal attributes of
Слайд 48Summary of the Basic Concepts
Supply Concepts
Stock of competitive properties
Changes in the stock
Influences
Summary of the Basic Concepts
Supply Concepts
Stock of competitive properties
Changes in the stock
Influences
Слайд 49Demand Side Economic Variables
Housing
Housing or Dwelling Unit versus Structure
Housing Unit versus Household
Single-family
Demand Side Economic Variables
Housing
Housing or Dwelling Unit versus Structure
Housing Unit versus Household
Single-family
Слайд 50Feasibility Rent
Definition:
The rent (income) required to attract new construction for a specific
Feasibility Rent
Definition:
The rent (income) required to attract new construction for a specific

Слайд 51Feasibility Rent
an example
Feasibility Rent
an example
Слайд 52Feasibility Rent
an example
Feasibility Rent
an example
Слайд 53Feasibility Rent
an example
Feasibility Rent
an example
 Международный спутниковый канал Интер+
 Проблемы и парадоксы введения ФГОС начального и основного общего образования
 Уважаемые собственники бизнеса, руководители предприятий! Мы поможем Вам провести: - логистический аудит и консультирование; - опт
 Презентация на тему Подготовка к сочинению-рассуждению (поле С)
 Занятие № 1: Организация, вооружение и военная техника взвода
 Antibiotic (Антибиотики)
 Школьная форма
 Портфолио студента
 Домашние опасности (2 класс)
 Пенсионные фонды, способы формирования и назначение
 Волшебная принцесса
 Distributed Version Control Systems
 Изображение и реальность
 Возрастные особенности интеллектуального развития учащихся начальной школы
  Проект«Создание элективного курса по географии для предпрофильной подготовки учащихся 9 классов».
 Католическая церковь: путь к вершине могущества
 Рельеф Южной Америки
 Метод проектов: общие положения. Проектная и исследовательская деятельность: сходство и различие
 Управленческий учет (лекции)
 Александр Иванович Куприн
 Урок на тему : «Исследование функции с помощью производной»с использованием компьютерных технологийУчитель математики Бахт
 Закономерности управления персоналом
 1 2 На протяжении 60 лет ISKRAEMECO является одним из мировых лидеров в области производства приборов и систем учета. На сегодняшний день I
 Презентация на тему Образование и философия
  Сертификация продукции
 ДО АВГУСТА 2008
 Железнодорожные перевозки по всей России!
 Микены и Троя. История Древнего мира