- SUPPLY AND DEMAND

Содержание
- 2. 7 Consumers, Producers, and the Efficiency of Markets
- 3. REVISITING THE MARKET EQUILIBRIUM Do the equilibrium price and quantity maximize the total welfare of buyers
- 4. Welfare Economics Welfare economics is the study of how the allocation of resources affects economic well-being.
- 5. Welfare Economics Equilibrium in the market results in maximum benefits, and therefore maximum total welfare for
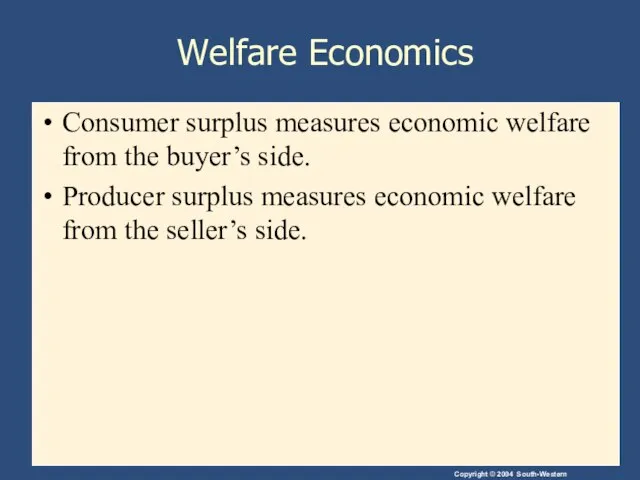
- 6. Welfare Economics Consumer surplus measures economic welfare from the buyer’s side. Producer surplus measures economic welfare
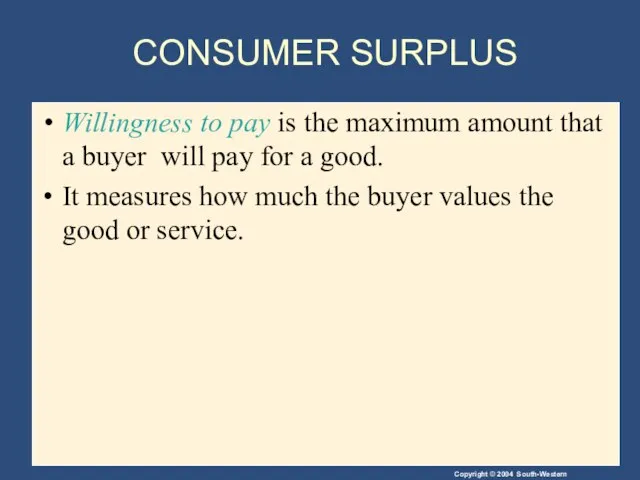
- 7. CONSUMER SURPLUS Willingness to pay is the maximum amount that a buyer will pay for a
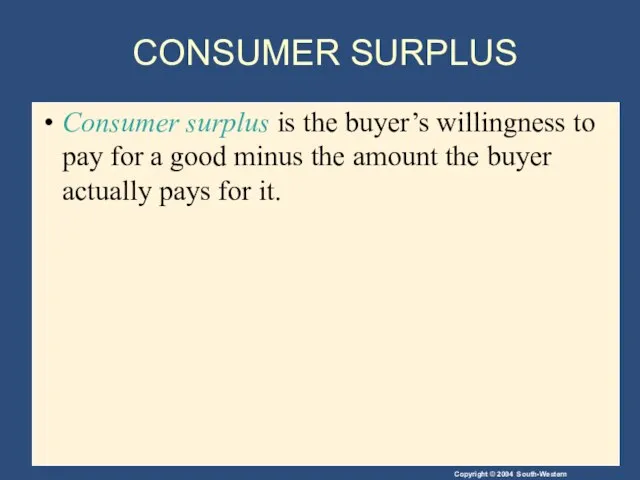
- 8. CONSUMER SURPLUS Consumer surplus is the buyer’s willingness to pay for a good minus the amount
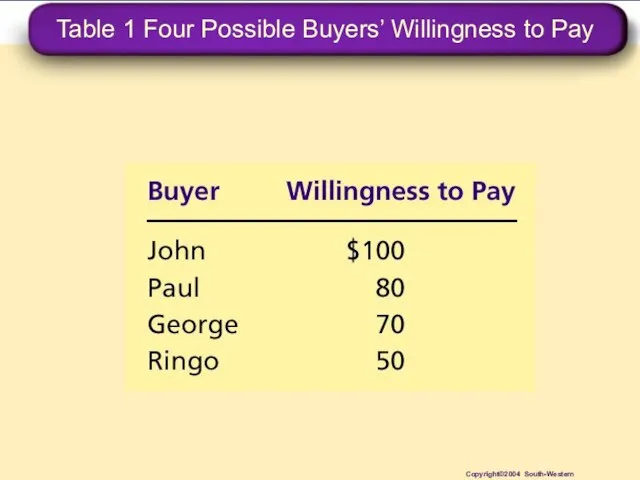
- 9. Table 1 Four Possible Buyers’ Willingness to Pay Copyright©2004 South-Western
- 10. CONSUMER SURPLUS The market demand curve depicts the various quantities that buyers would be willing and
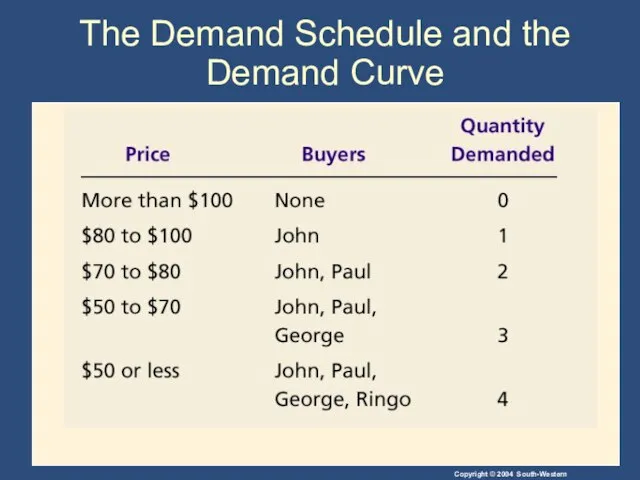
- 11. The Demand Schedule and the Demand Curve
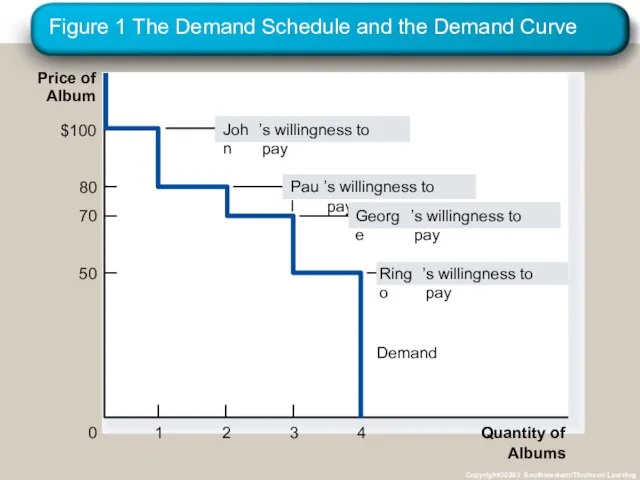
- 12. Figure 1 The Demand Schedule and the Demand Curve Copyright©2003 Southwestern/Thomson Learning Price of Album 0
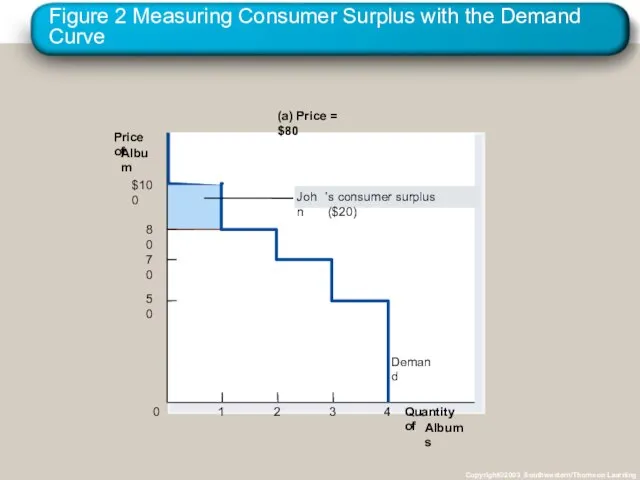
- 13. Figure 2 Measuring Consumer Surplus with the Demand Curve Copyright©2003 Southwestern/Thomson Learning (a) Price = $80
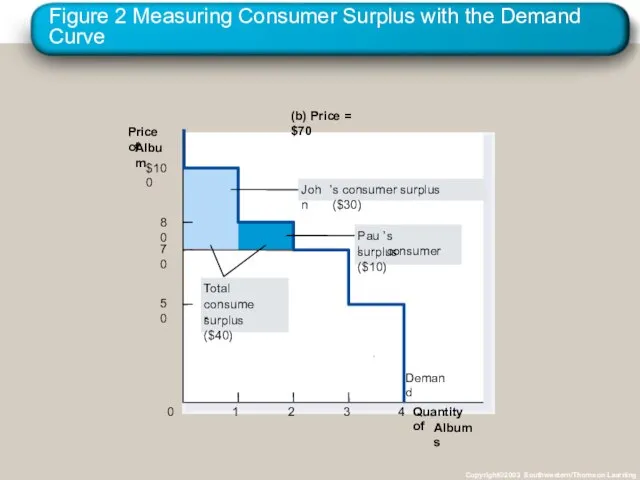
- 14. Figure 2 Measuring Consumer Surplus with the Demand Curve Copyright©2003 Southwestern/Thomson Learning (b) Price = $70
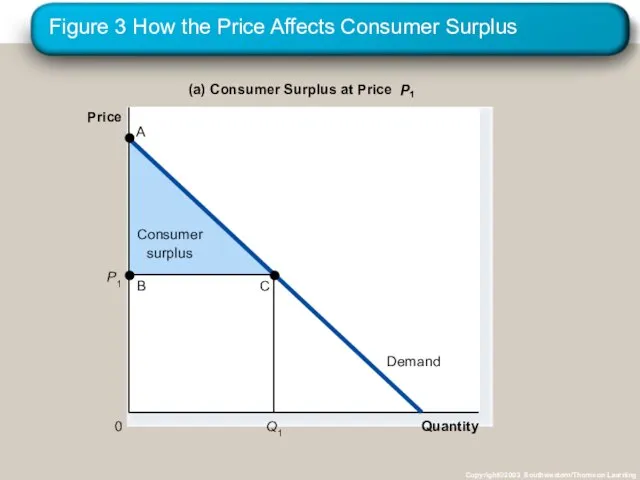
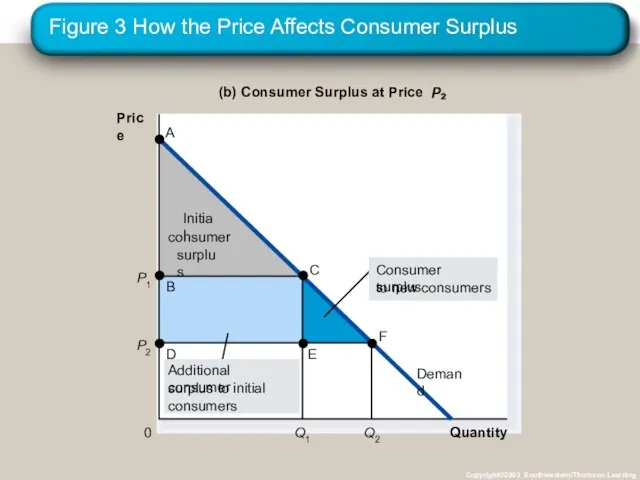
- 15. Using the Demand Curve to Measure Consumer Surplus The area below the demand curve and above
- 16. Figure 3 How the Price Affects Consumer Surplus Copyright©2003 Southwestern/Thomson Learning Quantity (a) Consumer Surplus at
- 17. Figure 3 How the Price Affects Consumer Surplus Copyright©2003 Southwestern/Thomson Learning Quantity (b) Consumer Surplus at
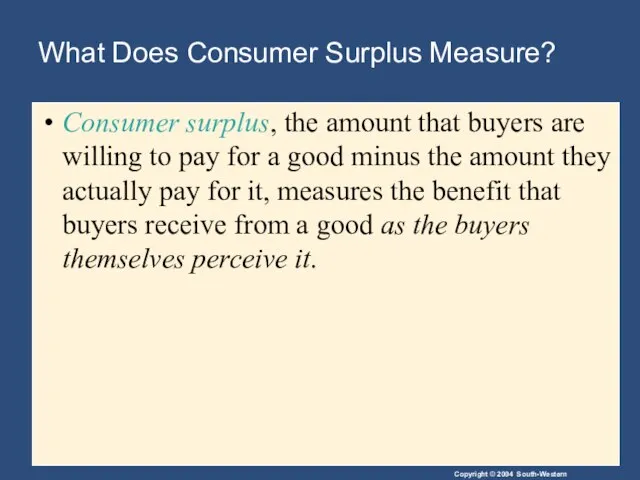
- 18. What Does Consumer Surplus Measure? Consumer surplus, the amount that buyers are willing to pay for
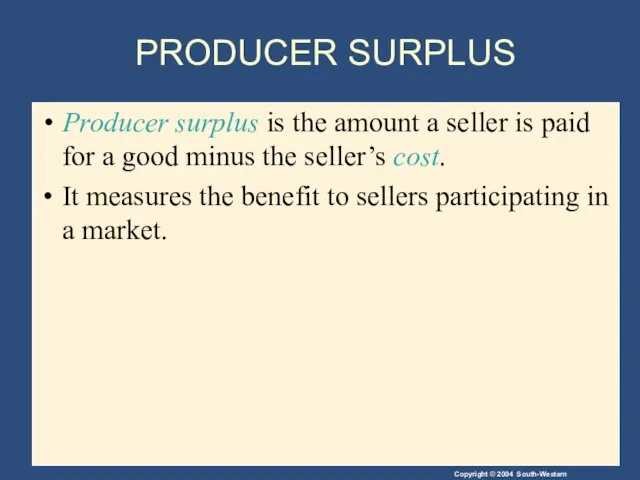
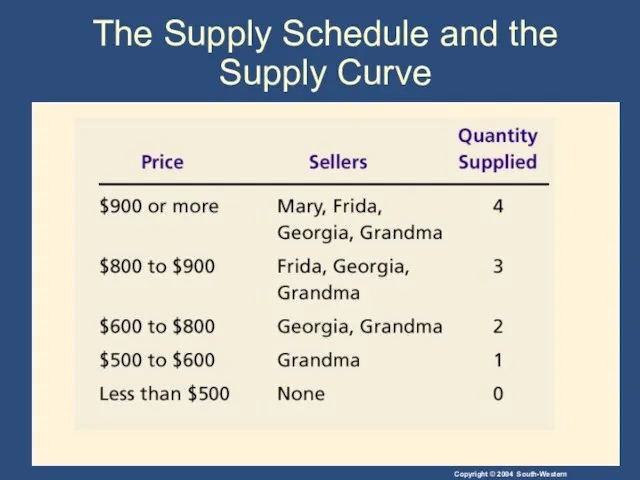
- 19. PRODUCER SURPLUS Producer surplus is the amount a seller is paid for a good minus the
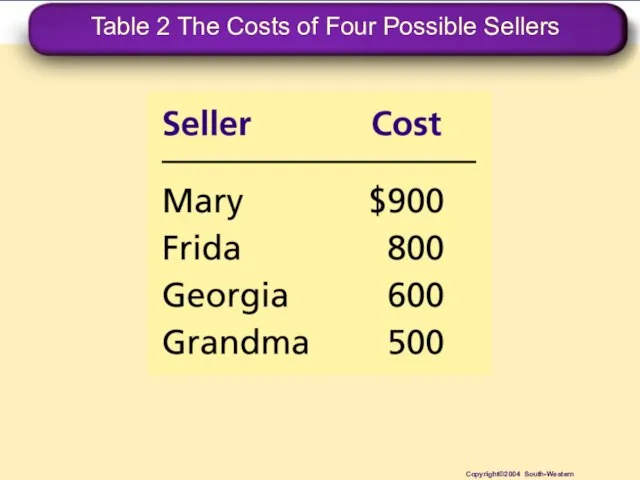
- 20. Table 2 The Costs of Four Possible Sellers Copyright©2004 South-Western
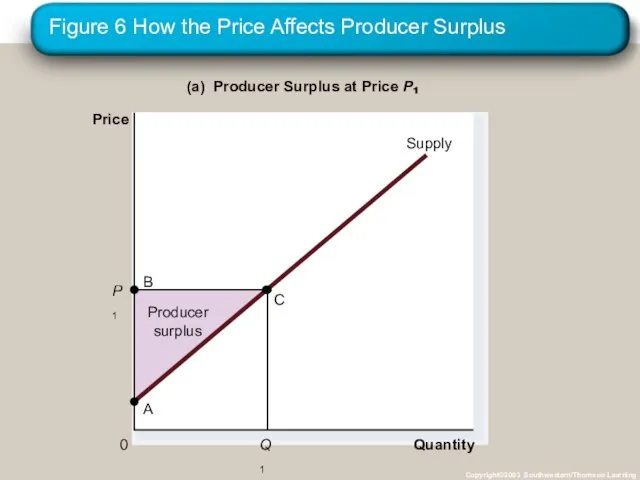
- 21. Using the Supply Curve to Measure Producer Surplus Just as consumer surplus is related to the
- 22. The Supply Schedule and the Supply Curve
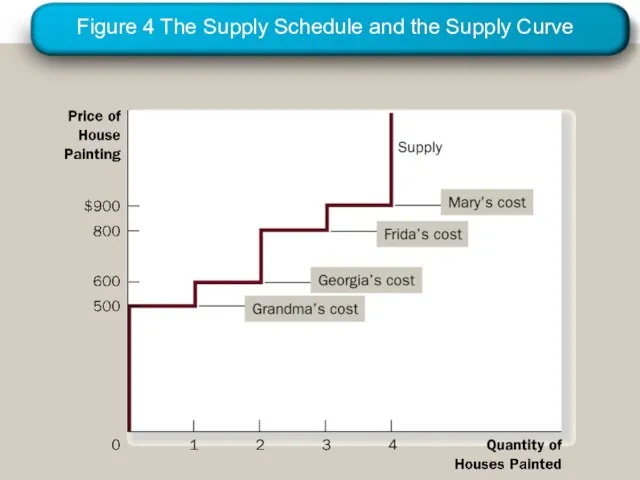
- 23. Figure 4 The Supply Schedule and the Supply Curve
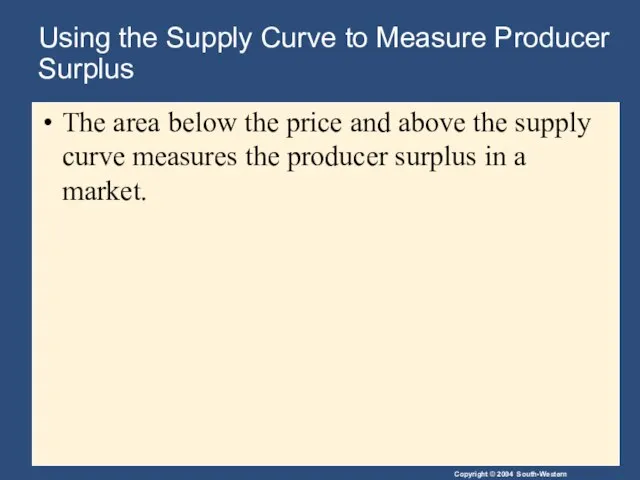
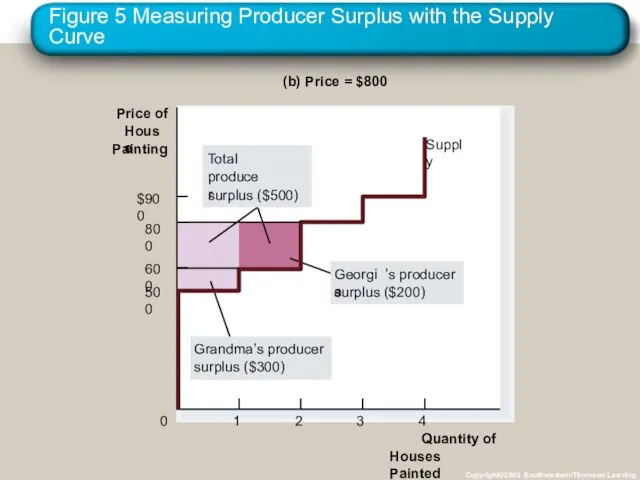
- 24. Using the Supply Curve to Measure Producer Surplus The area below the price and above the
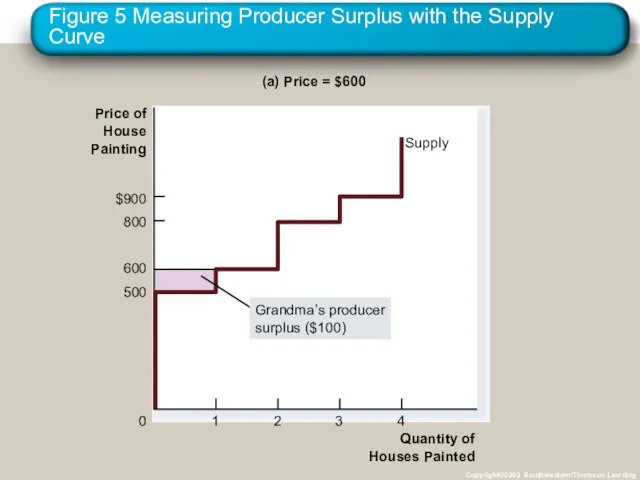
- 25. Figure 5 Measuring Producer Surplus with the Supply Curve Copyright©2003 Southwestern/Thomson Learning Quantity of Houses Painted
- 26. Figure 5 Measuring Producer Surplus with the Supply Curve Copyright©2003 Southwestern/Thomson Learning Quantity of Houses Painted
- 27. Figure 6 How the Price Affects Producer Surplus Copyright©2003 Southwestern/Thomson Learning Quantity (a) Producer Surplus at
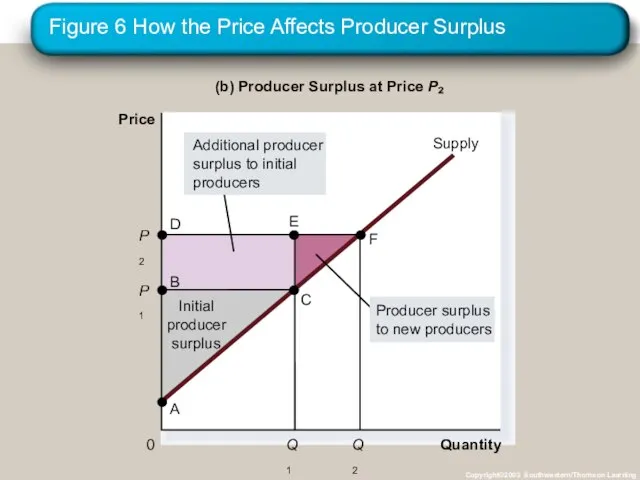
- 28. Figure 6 How the Price Affects Producer Surplus Copyright©2003 Southwestern/Thomson Learning Quantity (b) Producer Surplus at
- 29. MARKET EFFICIENCY Consumer surplus and producer surplus may be used to address the following question: Is
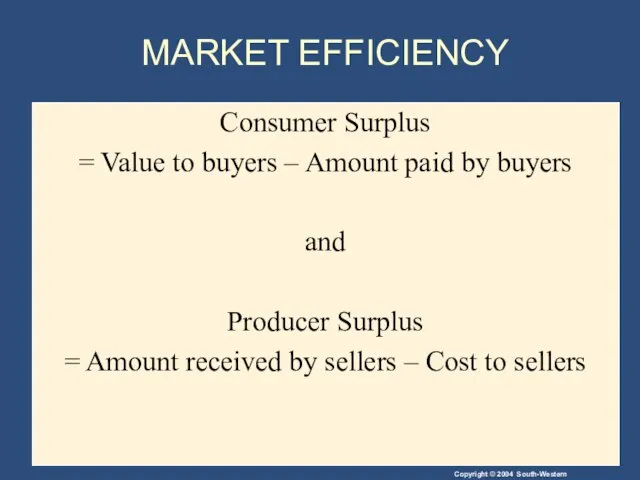
- 30. MARKET EFFICIENCY Consumer Surplus = Value to buyers – Amount paid by buyers and Producer Surplus
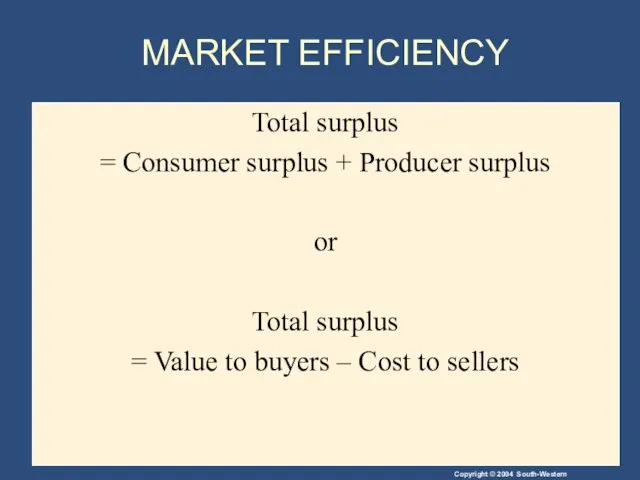
- 31. MARKET EFFICIENCY Total surplus = Consumer surplus + Producer surplus or Total surplus = Value to
- 32. MARKET EFFICIENCY Efficiency is the property of a resource allocation of maximizing the total surplus received
- 33. MARKET EFFICIENCY In addition to market efficiency, a social planner might also care about equity –
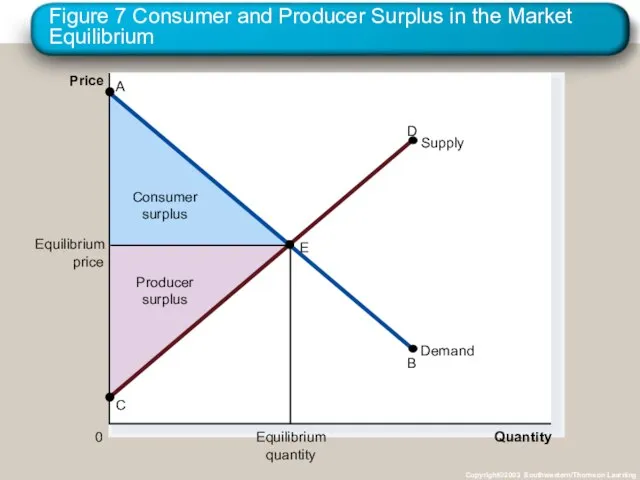
- 34. Figure 7 Consumer and Producer Surplus in the Market Equilibrium Copyright©2003 Southwestern/Thomson Learning Price 0 Quantity
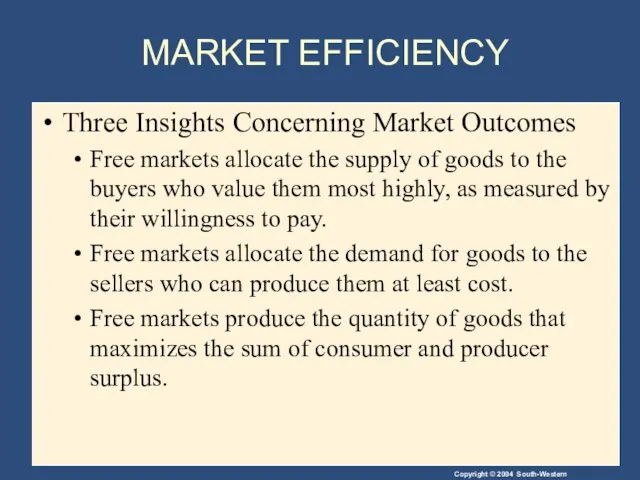
- 35. MARKET EFFICIENCY Three Insights Concerning Market Outcomes Free markets allocate the supply of goods to the
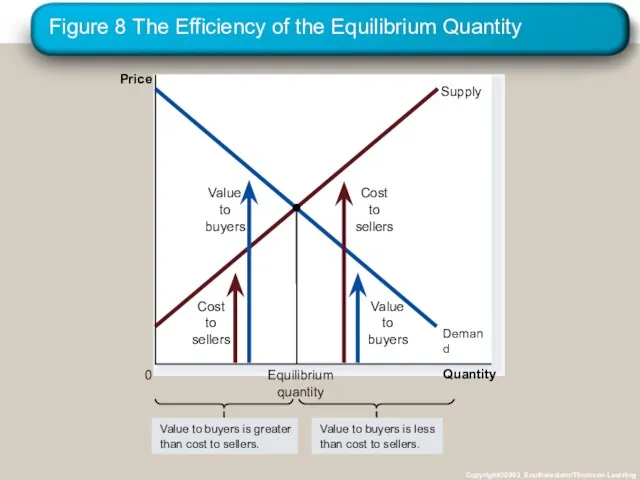
- 36. Figure 8 The Efficiency of the Equilibrium Quantity Copyright©2003 Southwestern/Thomson Learning Quantity Price 0
- 37. Evaluating the Market Equilibrium Because the equilibrium outcome is an efficient allocation of resources, the social
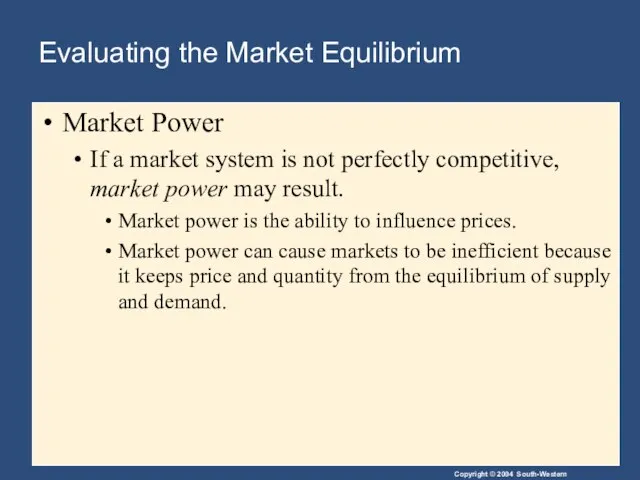
- 38. Evaluating the Market Equilibrium Market Power If a market system is not perfectly competitive, market power
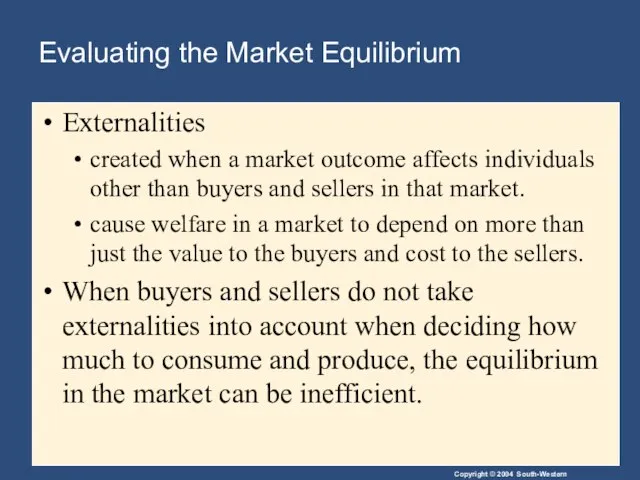
- 39. Evaluating the Market Equilibrium Externalities created when a market outcome affects individuals other than buyers and
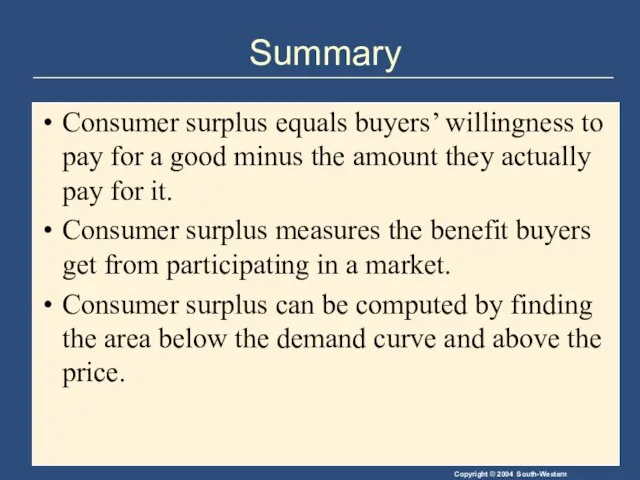
- 40. Summary Consumer surplus equals buyers’ willingness to pay for a good minus the amount they actually
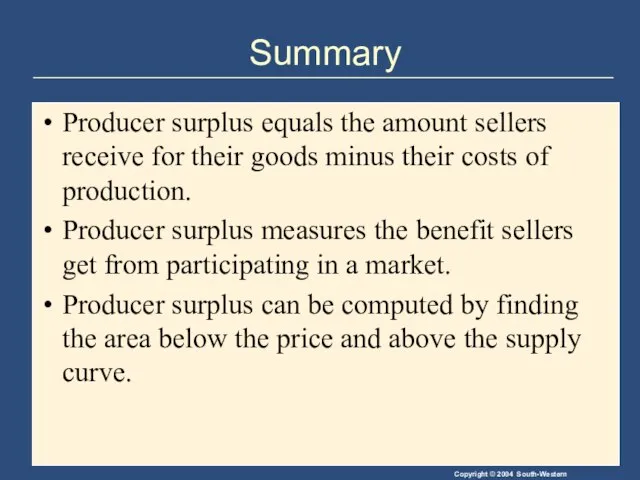
- 41. Summary Producer surplus equals the amount sellers receive for their goods minus their costs of production.
- 42. Summary An allocation of resources that maximizes the sum of consumer and producer surplus is said
- 44. Скачать презентацию
Слайд 3REVISITING THE MARKET EQUILIBRIUM
Do the equilibrium price and quantity maximize the total
REVISITING THE MARKET EQUILIBRIUM
Do the equilibrium price and quantity maximize the total
Слайд 4Welfare Economics
Welfare economics is the study of how the allocation of resources
Welfare Economics
Welfare economics is the study of how the allocation of resources
Слайд 5Welfare Economics
Equilibrium in the market results in maximum benefits, and therefore maximum
Welfare Economics
Equilibrium in the market results in maximum benefits, and therefore maximum
Слайд 6Welfare Economics
Consumer surplus measures economic welfare from the buyer’s side.
Producer surplus measures
Welfare Economics
Consumer surplus measures economic welfare from the buyer’s side.
Producer surplus measures
Слайд 7CONSUMER SURPLUS
Willingness to pay is the maximum amount that a buyer will
CONSUMER SURPLUS
Willingness to pay is the maximum amount that a buyer will
Слайд 8CONSUMER SURPLUS
Consumer surplus is the buyer’s willingness to pay for a good
CONSUMER SURPLUS
Consumer surplus is the buyer’s willingness to pay for a good
Слайд 9Table 1 Four Possible Buyers’ Willingness to Pay
Copyright©2004 South-Western
Table 1 Four Possible Buyers’ Willingness to Pay
Copyright©2004 South-Western
Слайд 10CONSUMER SURPLUS
The market demand curve depicts the various quantities that buyers would
CONSUMER SURPLUS
The market demand curve depicts the various quantities that buyers would
Слайд 11The Demand Schedule and the Demand Curve
The Demand Schedule and the Demand Curve
Слайд 12Figure 1 The Demand Schedule and the Demand Curve
Copyright©2003 Southwestern/Thomson Learning
Price of
Album
0
Quantity
Figure 1 The Demand Schedule and the Demand Curve
Copyright©2003 Southwestern/Thomson Learning
Price of
Album
0
Quantity
Слайд 13Figure 2 Measuring Consumer Surplus with the Demand Curve
Copyright©2003 Southwestern/Thomson Learning
(a) Price
Figure 2 Measuring Consumer Surplus with the Demand Curve
Copyright©2003 Southwestern/Thomson Learning
(a) Price
Слайд 14Figure 2 Measuring Consumer Surplus with the Demand Curve
Copyright©2003 Southwestern/Thomson Learning
(b) Price
Figure 2 Measuring Consumer Surplus with the Demand Curve
Copyright©2003 Southwestern/Thomson Learning
(b) Price
Слайд 15Using the Demand Curve to Measure Consumer Surplus
The area below the demand
Using the Demand Curve to Measure Consumer Surplus
The area below the demand
Слайд 16Figure 3 How the Price Affects Consumer Surplus
Copyright©2003 Southwestern/Thomson Learning
Quantity
(a) Consumer Surplus
Figure 3 How the Price Affects Consumer Surplus
Copyright©2003 Southwestern/Thomson Learning
Quantity
(a) Consumer Surplus
Слайд 17Figure 3 How the Price Affects Consumer Surplus
Copyright©2003 Southwestern/Thomson Learning
Quantity
(b) Consumer Surplus
Figure 3 How the Price Affects Consumer Surplus
Copyright©2003 Southwestern/Thomson Learning
Quantity
(b) Consumer Surplus
Слайд 18What Does Consumer Surplus Measure?
Consumer surplus, the amount that buyers are willing
What Does Consumer Surplus Measure?
Consumer surplus, the amount that buyers are willing
Слайд 19PRODUCER SURPLUS
Producer surplus is the amount a seller is paid for a
PRODUCER SURPLUS
Producer surplus is the amount a seller is paid for a
Слайд 20Table 2 The Costs of Four Possible Sellers
Copyright©2004 South-Western
Table 2 The Costs of Four Possible Sellers
Copyright©2004 South-Western
Слайд 21Using the Supply Curve to Measure Producer Surplus
Just as consumer surplus is
Using the Supply Curve to Measure Producer Surplus
Just as consumer surplus is
Слайд 22The Supply Schedule and the Supply Curve
The Supply Schedule and the Supply Curve
Слайд 23Figure 4 The Supply Schedule and the Supply Curve
Figure 4 The Supply Schedule and the Supply Curve
Слайд 24Using the Supply Curve to Measure Producer Surplus
The area below the price
Using the Supply Curve to Measure Producer Surplus
The area below the price
Слайд 25Figure 5 Measuring Producer Surplus with the Supply Curve
Copyright©2003 Southwestern/Thomson Learning
Quantity of
Houses
Figure 5 Measuring Producer Surplus with the Supply Curve
Copyright©2003 Southwestern/Thomson Learning
Quantity of
Houses
Слайд 26Figure 5 Measuring Producer Surplus with the Supply Curve
Copyright©2003 Southwestern/Thomson Learning
Quantity of
Houses
Figure 5 Measuring Producer Surplus with the Supply Curve
Copyright©2003 Southwestern/Thomson Learning
Quantity of
Houses
Слайд 27Figure 6 How the Price Affects Producer Surplus
Copyright©2003 Southwestern/Thomson Learning
Quantity
(a) Producer Surplus
Figure 6 How the Price Affects Producer Surplus
Copyright©2003 Southwestern/Thomson Learning
Quantity
(a) Producer Surplus
Слайд 28Figure 6 How the Price Affects Producer Surplus
Copyright©2003 Southwestern/Thomson Learning
Quantity
(b) Producer Surplus
Figure 6 How the Price Affects Producer Surplus
Copyright©2003 Southwestern/Thomson Learning
Quantity
(b) Producer Surplus
Слайд 29MARKET EFFICIENCY
Consumer surplus and producer surplus may be used to address the
MARKET EFFICIENCY
Consumer surplus and producer surplus may be used to address the
Слайд 30MARKET EFFICIENCY
Consumer Surplus
= Value to buyers – Amount paid by buyers
and
Producer
MARKET EFFICIENCY
Consumer Surplus
= Value to buyers – Amount paid by buyers
and
Producer
Слайд 31MARKET EFFICIENCY
Total surplus
= Consumer surplus + Producer surplus
or
Total surplus
= Value
MARKET EFFICIENCY
Total surplus
= Consumer surplus + Producer surplus
or
Total surplus
= Value
Слайд 32MARKET EFFICIENCY
Efficiency is the property of a resource allocation of maximizing the
MARKET EFFICIENCY
Efficiency is the property of a resource allocation of maximizing the
Слайд 33MARKET EFFICIENCY
In addition to market efficiency, a social planner might also care
MARKET EFFICIENCY
In addition to market efficiency, a social planner might also care
Слайд 34Figure 7 Consumer and Producer Surplus in the Market Equilibrium
Copyright©2003 Southwestern/Thomson Learning
Price
0
Quantity
Figure 7 Consumer and Producer Surplus in the Market Equilibrium
Copyright©2003 Southwestern/Thomson Learning
Price
0
Quantity
Слайд 35MARKET EFFICIENCY
Three Insights Concerning Market Outcomes
Free markets allocate the supply of
MARKET EFFICIENCY
Three Insights Concerning Market Outcomes
Free markets allocate the supply of
Слайд 36Figure 8 The Efficiency of the Equilibrium Quantity
Copyright©2003 Southwestern/Thomson Learning
Quantity
Price
0
Figure 8 The Efficiency of the Equilibrium Quantity
Copyright©2003 Southwestern/Thomson Learning
Quantity
Price
0
Слайд 37Evaluating the Market Equilibrium
Because the equilibrium outcome is an efficient allocation of
Evaluating the Market Equilibrium
Because the equilibrium outcome is an efficient allocation of
Слайд 38Evaluating the Market Equilibrium
Market Power
If a market system is not perfectly
Evaluating the Market Equilibrium
Market Power
If a market system is not perfectly
Слайд 39Evaluating the Market Equilibrium
Externalities
created when a market outcome affects individuals other
Evaluating the Market Equilibrium
Externalities
created when a market outcome affects individuals other
Слайд 40Summary
Consumer surplus equals buyers’ willingness to pay for a good minus the
Summary
Consumer surplus equals buyers’ willingness to pay for a good minus the
Слайд 41Summary
Producer surplus equals the amount sellers receive for their goods minus their
Summary
Producer surplus equals the amount sellers receive for their goods minus their
Слайд 42Summary
An allocation of resources that maximizes the sum of consumer and producer
Summary
An allocation of resources that maximizes the sum of consumer and producer
 Все о полиграфическом рынке
 Компания Ракурс
 Эмпирические социальные достижения
  Как возникло франкское государство
 Сложение чисел с помощью координатной прямой
 Значение творчества В.А.Серова для развития отечественной живописи
 CIVIL LAW Concept and grounds
 Неополис - город будущего. Город на реке: бренд успешной столицы
 Магистральные модели
 Тонкослойная хроматография
 Презентация на тему Строение цветка
  Основные устройства компьютера,их функции и взаимосвязь.
 Молекулярная эволюция и филогенетика
  КОНДИЦИОНЕРЫ Samsung 2009
 Пришедшая выручка
 Первобытные люди 4 класс
 Италия после второй мировой войны
 Магический кубик
 Закон о воспитании: план действий дошкольной организации по реализации новых положений законодательства
 d4798d3f5a007823a7d4b1743d3eced2
 Армянский Петербург
 НАЦИОНАЛЬНЫЙ ПЛАН УПРАВЛЕНИЯ ЗАСУХАМИ ПО ГРУЗИИ
 Презентация на тему Вакуумные приборы
  Тема лекции:«Электронная цифровая подпись»
 Электронный дневник и электронный журнал в NetSchool как часть комплексной информационной системы (с) 2001-2011 ИРТех
 А.С. Пушкин Краткая биография в картинках
 Перейти Рубикон
 Презентация на тему A history about David Livingstone