- The Labour Market

Содержание
- 2. The Labour Market The labour market is an example of a factor market Supply of labour
- 3. The Labour Market At higher wage rates the demand for labour will be less than at
- 4. Marginal Revenue Productivity Productivity refers to the amount produced per worker per period of time MRP
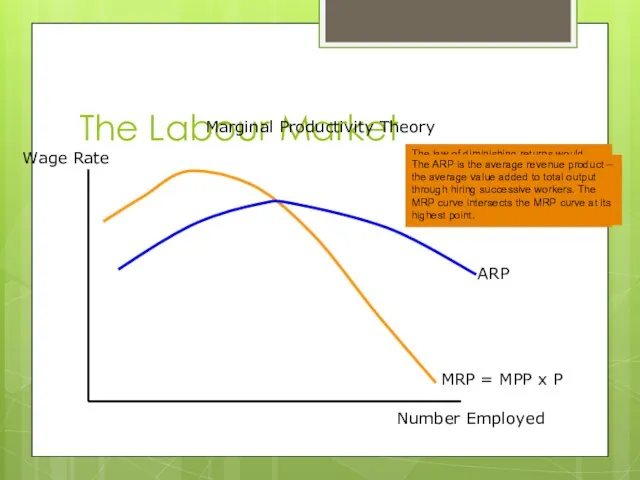
- 5. The Labour Market Marginal Productivity Theory Wage Rate Number Employed MRP = MPP x P ARP
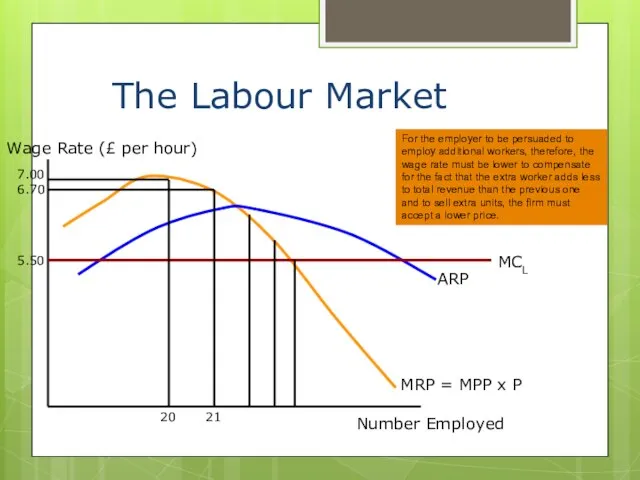
- 6. The Labour Market Wage Rate (£ per hour) Number Employed MRP = MPP x P ARP
- 7. The MRP curve therefore represents the demand curve for labour illustrating the derived demand relationship. Wage
- 8. The Labour Market The Supply of Labour The amount of people offering their labour at different
- 9. The Labour Market Income effect of a rise in wages: As wages rise, people feel better
- 10. The Labour Market The elasticity of supply of labour depends upon: Geographical mobility of labour: The
- 11. The Labour Market Occupational Mobility of Labour: Lack of information of available jobs in other occupations
- 12. The Labour Market Wage Rate (£ per hour) Number of Hours Worked SL 5 10 An
- 13. The Labour Market Wage Rate (£ per hour) Number of Hours Worked (per week) SL 5
- 14. The Labour Market Wage Rate (£ per hour) Number employed DL SL 6.00 Q1 The market
- 15. The Labour Market Wage Rate (£ per hour) Number employed DL SL 6.00 Q1 Q2 SL1
- 16. The Labour Market Economic Rent The value of the wage earned over and above that necessary
- 17. Economic Rent Wage Rate (£ per hour) Number of hours worked SL The supply of labour
- 18. Economic Rent Wage Rate (£ per hour) Number of hours worked SL 6.00 Q1 Q2 4.00
- 20. Скачать презентацию

Слайд 3The Labour Market
At higher wage rates the demand for labour will be
The Labour Market
At higher wage rates the demand for labour will be

Слайд 4Marginal Revenue Productivity
Productivity refers to the amount produced per worker per period
Marginal Revenue Productivity
Productivity refers to the amount produced per worker per period

Слайд 5The Labour Market
Marginal Productivity Theory
Wage Rate
Number Employed
MRP = MPP x P
ARP
The law
The Labour Market
Marginal Productivity Theory
Wage Rate
Number Employed
MRP = MPP x P
ARP
The law
Слайд 6The Labour Market
Wage Rate (£ per hour)
Number Employed
MRP = MPP x P
ARP
In
The Labour Market
Wage Rate (£ per hour)
Number Employed
MRP = MPP x P
ARP
In
Слайд 7The MRP curve therefore represents the demand curve for labour illustrating the
The MRP curve therefore represents the demand curve for labour illustrating the

Слайд 8The Labour Market
The Supply of Labour
The amount of people offering their labour
The Labour Market
The Supply of Labour
The amount of people offering their labour

Слайд 9The Labour Market
Income effect of a rise in wages:
As wages rise, people
The Labour Market
Income effect of a rise in wages:
As wages rise, people

Слайд 10The Labour Market
The elasticity of supply of labour depends upon:
Geographical mobility of
The Labour Market
The elasticity of supply of labour depends upon:
Geographical mobility of

Слайд 11The Labour Market
Occupational Mobility of Labour:
Lack of information of available jobs in
The Labour Market
Occupational Mobility of Labour:
Lack of information of available jobs in

Слайд 12The Labour Market
Wage Rate (£ per hour)
Number of Hours Worked
SL
5
10
An inelastic supply
The Labour Market
Wage Rate (£ per hour)
Number of Hours Worked
SL
5
10
An inelastic supply

Слайд 13The Labour Market
Wage Rate (£ per hour)
Number of Hours Worked
(per week)
SL
5
5.50
35
45
If the
The Labour Market
Wage Rate (£ per hour)
Number of Hours Worked
(per week)
SL
5
5.50
35
45
If the

Слайд 14The Labour Market
Wage Rate (£ per hour)
Number employed
DL
SL
6.00
Q1
The market wage rate for
The Labour Market
Wage Rate (£ per hour)
Number employed
DL
SL
6.00
Q1
The market wage rate for

Слайд 15The Labour Market
Wage Rate (£ per hour)
Number employed
DL
SL
6.00
Q1
Q2
SL1
Excess Supply
An increase in the
The Labour Market
Wage Rate (£ per hour)
Number employed
DL
SL
6.00
Q1
Q2
SL1
Excess Supply
An increase in the

Слайд 16The Labour Market
Economic Rent The value of the wage earned over and
The Labour Market
Economic Rent The value of the wage earned over and

Слайд 17Economic Rent
Wage Rate (£ per hour)
Number of hours worked
SL
The supply of labour
Economic Rent
Wage Rate (£ per hour)
Number of hours worked
SL
The supply of labour

Слайд 18Economic Rent
Wage Rate (£ per hour)
Number of hours worked
SL
6.00
Q1
Q2
4.00
Some individuals would have
Economic Rent
Wage Rate (£ per hour)
Number of hours worked
SL
6.00
Q1
Q2
4.00
Some individuals would have

 Обобщенные классы в C# Киньзибаев Рашид. - презентация
 жараның жазылуы
 Медиаразмещенияв Украине и России
 Договор доверительного управления имуществом
 Формирование УУД средствами ИКТ на примере урока литературного чтения
 Математический КВН
 Организация совместной работы музыкального руководителя и специалистов ДОУ
 Внеклассная работа в начальной школе
 GRANDECO TILEПроизводствоительDI CHEMICAL CO., LTD (Южная Корея)
 Нормативное правовое регулирование формирования федеральных перечней учебников и перечня организаций, издающих учебные пособия
 Рабочая группаРоссийской академии медицинских наук
 Презентация на тему Термодинамика
  Причины Первой мировой войны. Начало войны между странами Антанты и Тройственным союзом
 95-летие со дня рождения дважды Героя Советского Союза Г.А.Речкалова
 Управление компьютером с помощью меню
 Подготовка к специальным методам обследования
 С днём отца
 Вышивка крестом
 Самостоятельные процедуры
 Презентация на тему Массаж
  Пьер де ферма его вклад в математику
 Исследование свойства цвета светлота
 ОСЛОЖНЕНИЯ АБОРТА
 Вид из окна
 Городское методическое объединение классных руководителей
 TRF : Программы для публичных и школьных библиотек, работающих с детьми и подростками Автор презентации- Янков А.В., РГЮБ. - презентаци
 Лекция 5. Мероприятия и методические рекомендации по повышению энергоэффективности системы освещения и электрооборудования
 Ландшафтная архитектура