Вариации оптической и инфракрасной прозрачности атмосферы Земли под действием космических лучей и изменение термодинамических
- Вариации оптической и инфракрасной прозрачности атмосферы Земли под действием космических лучей и изменение термодинамических

Содержание
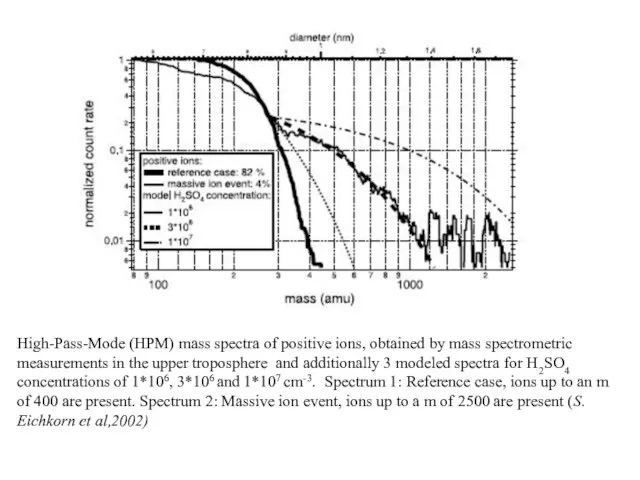
- 3. High-Pass-Mode (HPM) mass spectra of positive ions, obtained by mass spectrometric measurements in the upper troposphere
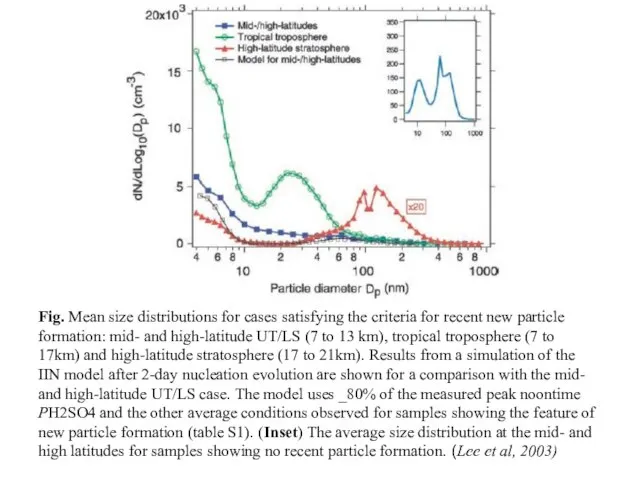
- 4. Fig. Mean size distributions for cases satisfying the criteria for recent new particle formation: mid- and
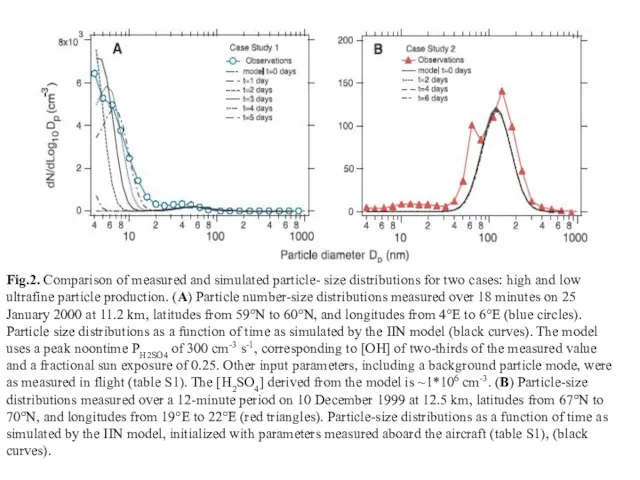
- 5. Fig.2. Comparison of measured and simulated particle- size distributions for two cases: high and low ultrafine
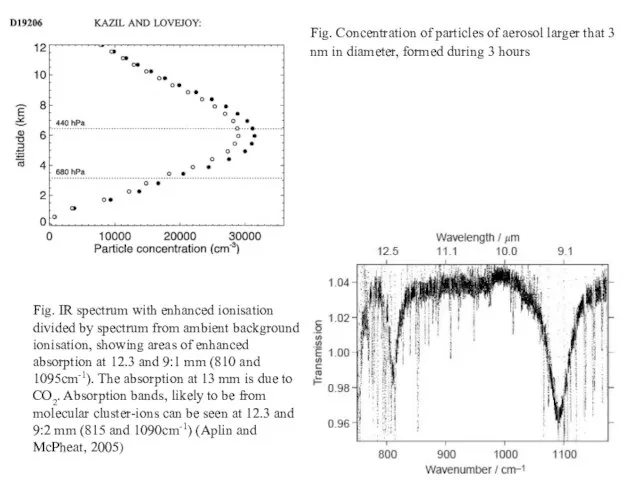
- 6. Fig. Concentration of particles of aerosol larger that 3 nm in diameter, formed during 3 hours
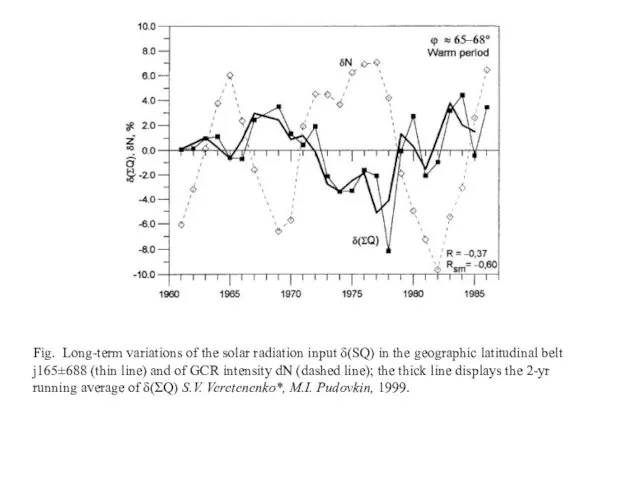
- 7. Fig. Long-term variations of the solar radiation input δ(SQ) in the geographic latitudinal belt j165±688 (thin
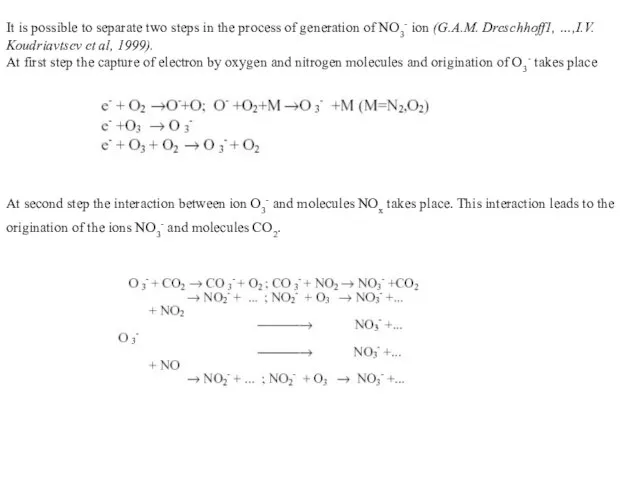
- 8. It is possible to separate two steps in the process of generation of NO3- ion (G.A.M.
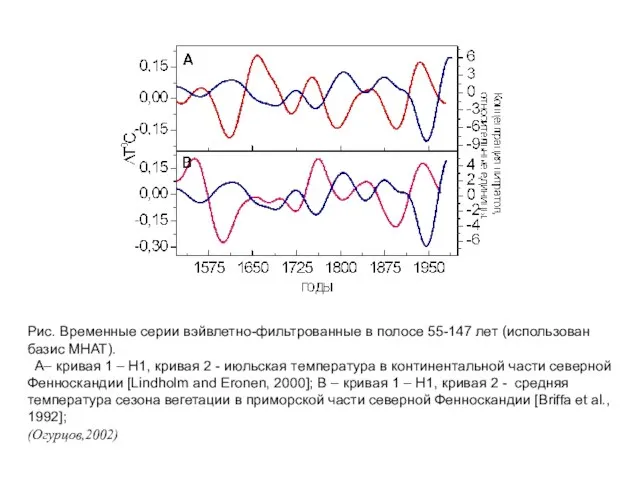
- 9. Рис. Временные серии вэйвлетно-фильтрованные в полосе 55-147 лет (использован базис MHAT). A– кривая 1 – Н1,
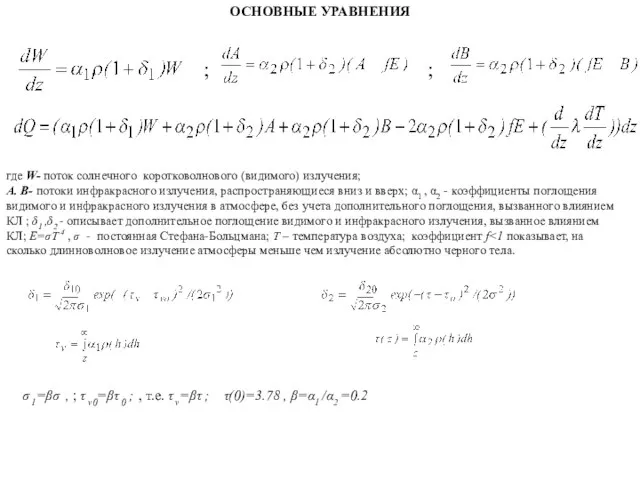
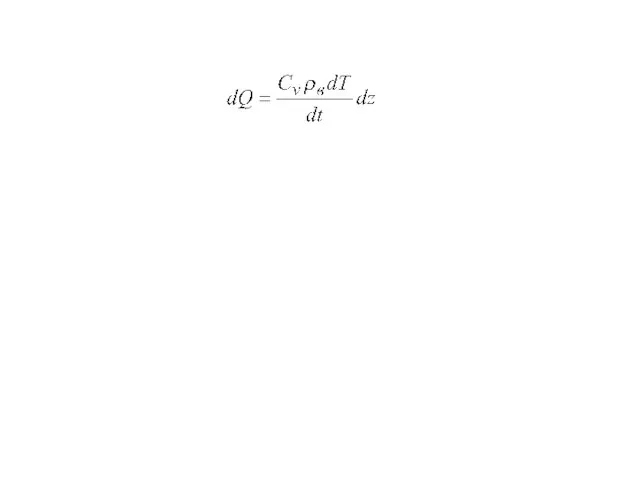
- 10. ОСНОВНЫЕ УРАВНЕНИЯ ; ; где W- поток солнечного коротковолнового (видимого) излучения; A. B- потоки инфракрасного излучения,
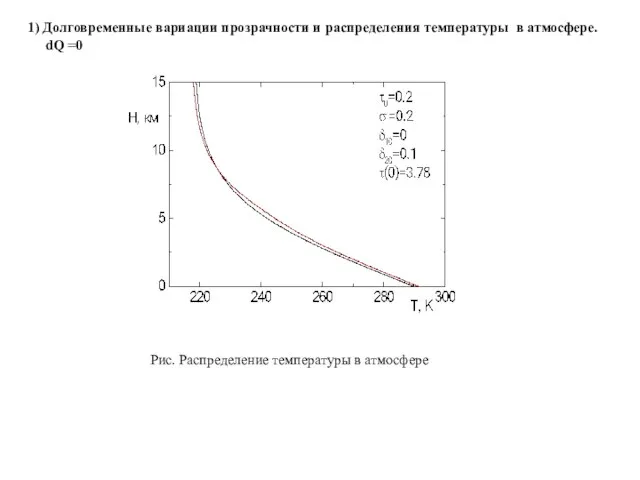
- 11. 1) Долговременные вариации прозрачности и распределения температуры в атмосфере. dQ =0 Рис. Распределение температуры в атмосфере
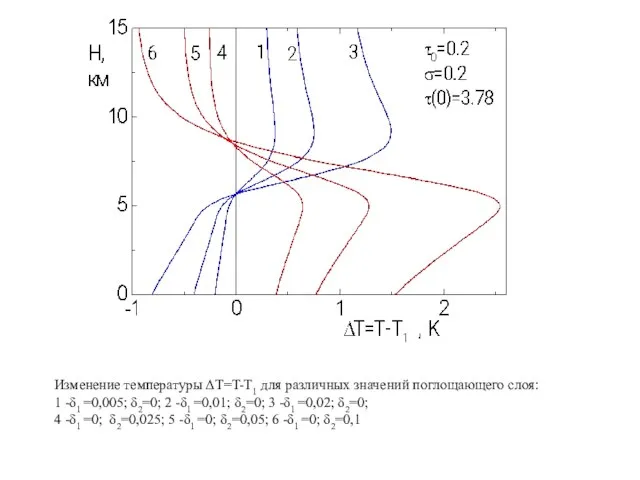
- 12. Изменение температуры ΔT=T-T1 для различных значений поглощающего слоя: 1 -δ1 =0,005; δ2=0; 2 -δ1 =0,01; δ2=0;
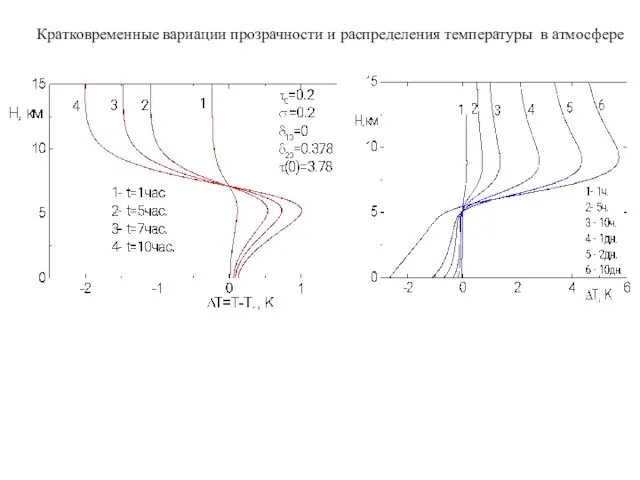
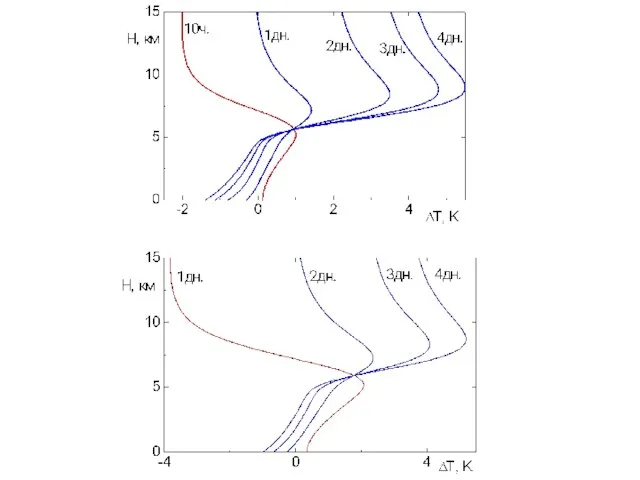
- 13. Кратковременные вариации прозрачности и распределения температуры в атмосфере
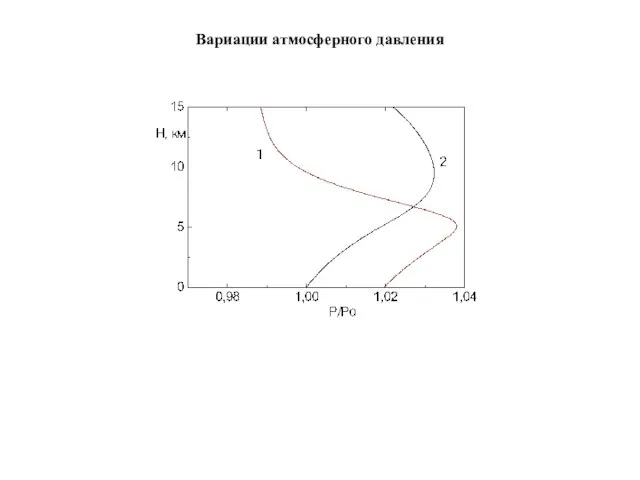
- 15. Вариации атмосферного давления
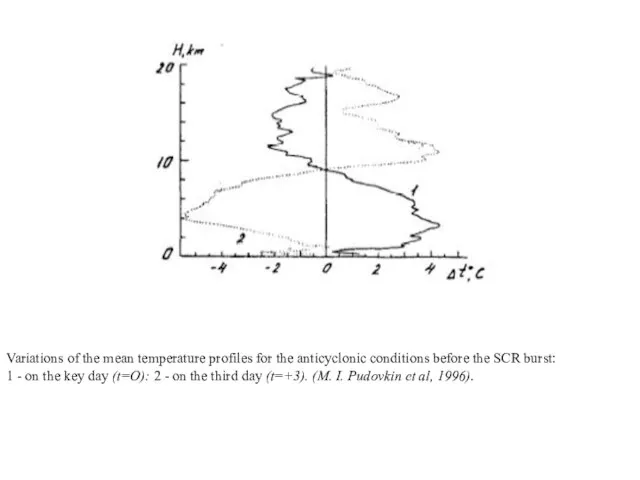
- 16. Variations of the mean temperature profiles for the anticyclonic conditions before the SCR burst: 1 -
- 20. Скачать презентацию
Слайд 3High-Pass-Mode (HPM) mass spectra of positive ions, obtained by mass spectrometric measurements
High-Pass-Mode (HPM) mass spectra of positive ions, obtained by mass spectrometric measurements
Слайд 4Fig. Mean size distributions for cases satisfying the criteria for recent new
Fig. Mean size distributions for cases satisfying the criteria for recent new
Слайд 5Fig.2. Comparison of measured and simulated particle- size distributions for two cases:
Fig.2. Comparison of measured and simulated particle- size distributions for two cases:
Слайд 6Fig. Concentration of particles of aerosol larger that 3 nm in diameter,
Fig. Concentration of particles of aerosol larger that 3 nm in diameter,
Слайд 7Fig. Long-term variations of the solar radiation input δ(SQ) in the geographic
Fig. Long-term variations of the solar radiation input δ(SQ) in the geographic
Слайд 8It is possible to separate two steps in the process of generation
It is possible to separate two steps in the process of generation
Слайд 9Рис. Временные серии вэйвлетно-фильтрованные в полосе 55-147 лет (использован базис MHAT).
A–
Рис. Временные серии вэйвлетно-фильтрованные в полосе 55-147 лет (использован базис MHAT).
A–
Слайд 10ОСНОВНЫЕ УРАВНЕНИЯ
;
;
где W- поток солнечного коротковолнового (видимого) излучения;
A. B- потоки инфракрасного излучения,
ОСНОВНЫЕ УРАВНЕНИЯ
;
;
где W- поток солнечного коротковолнового (видимого) излучения;
A. B- потоки инфракрасного излучения,
Слайд 111) Долговременные вариации прозрачности и распределения температуры в атмосфере.
dQ =0
Рис.
1) Долговременные вариации прозрачности и распределения температуры в атмосфере.
dQ =0
Рис.
Слайд 12Изменение температуры ΔT=T-T1 для различных значений поглощающего слоя:
1 -δ1 =0,005; δ2=0; 2
Изменение температуры ΔT=T-T1 для различных значений поглощающего слоя:
1 -δ1 =0,005; δ2=0; 2
Слайд 13Кратковременные вариации прозрачности и распределения температуры в атмосфере
Кратковременные вариации прозрачности и распределения температуры в атмосфере
Слайд 15Вариации атмосферного давления
Вариации атмосферного давления
Слайд 16Variations of the mean temperature profiles for the anticyclonic conditions before the
Variations of the mean temperature profiles for the anticyclonic conditions before the
 Мировое древо в различных культурах
 Презентация на тему Загрязнение атмосферы
  2 Будь лучше вместе с лучшими! Новые возможности более высокой дополнительной скидки!
 Профессия сварщик. Кто такой сварщик?
 Архитектура проекта Медиашоу
 Электроснабжение железных дорог
 Бизнес-информатика. Анализ ниши в Москве
 Моделирование и формализация 11 класс
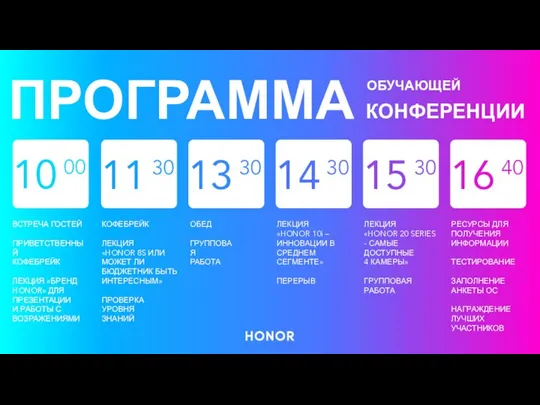 Предполагаемая программа мероприятий
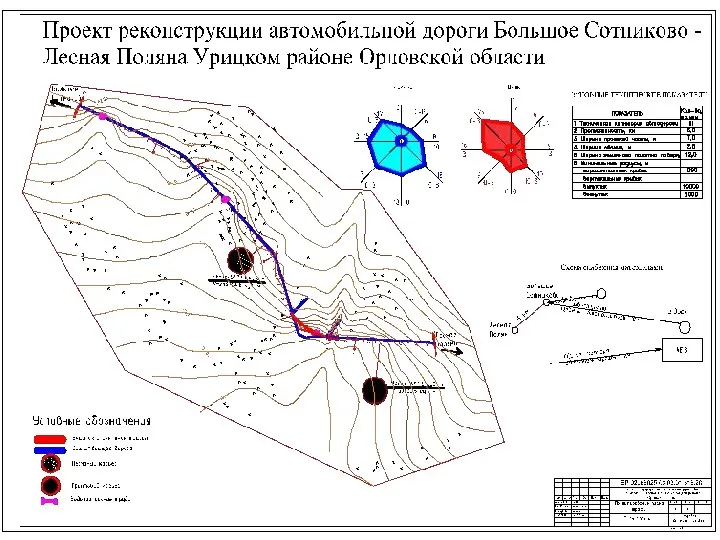 Проект реконструкции автомобильной дороги Большое Сотниково - Лесная поляна Урицком районе Орловской области
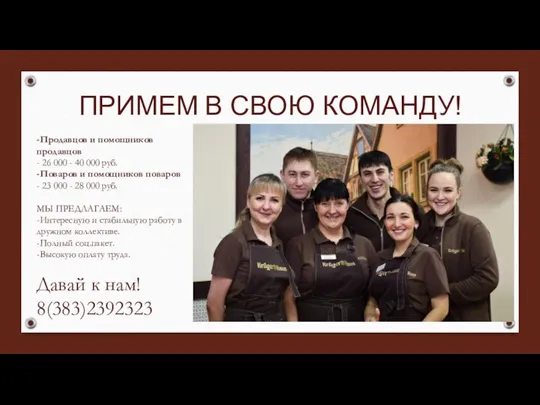 Кадры. Примем в свою команду! -Продавцов и помощников продавцов
 5
5 Вышивка
 Кодекс ГТС. Принципи взаємодії з прямим споживачем
 Комплексное инженерное и социальное благоустройство группы зданий
 Интерьер аудитории Информационных технологий
 Темы для докладов
 Права человека.
 Служба социально-психологической поддержки людей с ВИЧ Консультативный Консультативныйкабинет Центр для женщин и детей Поддержк
 Контрольная работа по творчеству М.Ю.Лермонтова,Н.В.Гоголя, М.Е.Салтыкова-Щедрина. (Урок по литературе для 8 класса).
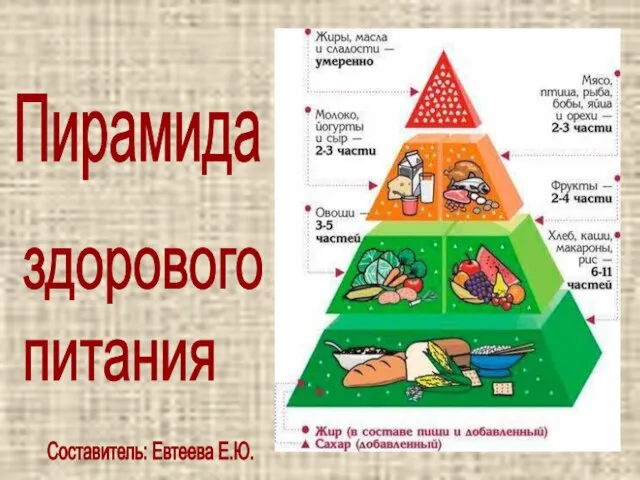 Пирамида
 СЛОВООБРАЗОВАНИЕ ИСЛОВОИЗМЕНЕНИЕ
 Лаборатория оптики океана
 Презентация на тему Япония страна восходящего солнца
 Школа хороших манер
 Изображение характера животных на рисунке (2 класс)
 В мире много сказок...
 Презентация на тему Конвекция. Излучение