- Comparative analysis of electric power complexes of the European Union and Russia

Содержание
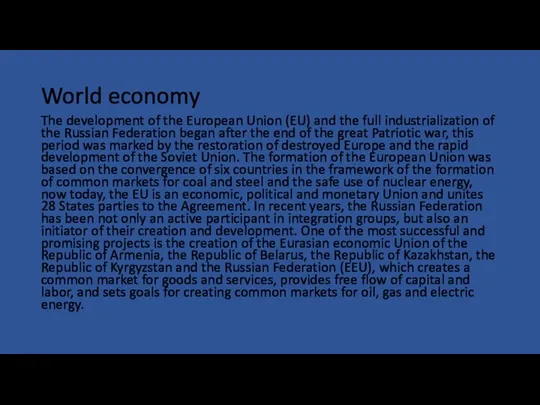
- 2. World economy The development of the European Union (EU) and the full industrialization of the Russian
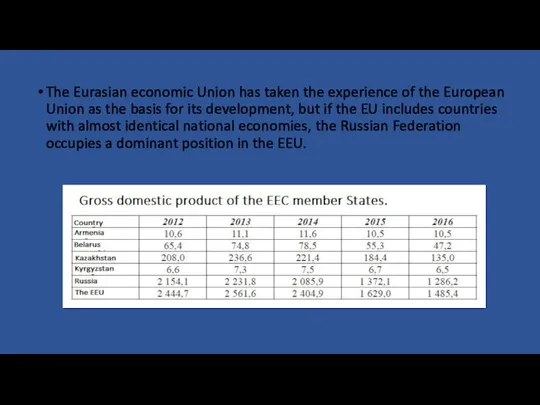
- 3. The Eurasian economic Union has taken the experience of the European Union as the basis for
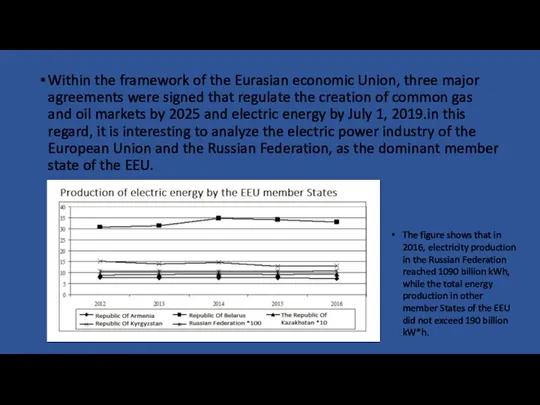
- 4. Within the framework of the Eurasian economic Union, three major agreements were signed that regulate the
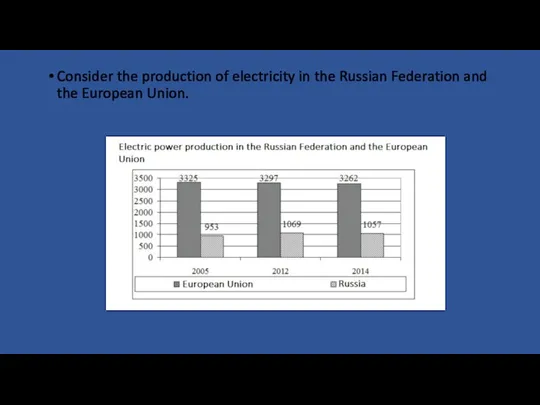
- 5. Consider the production of electricity in the Russian Federation and the European Union.
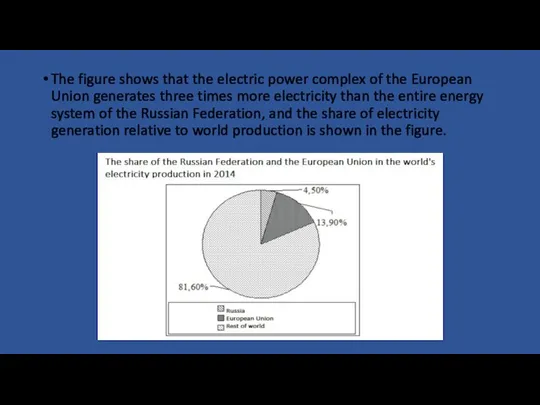
- 6. The figure shows that the electric power complex of the European Union generates three times more
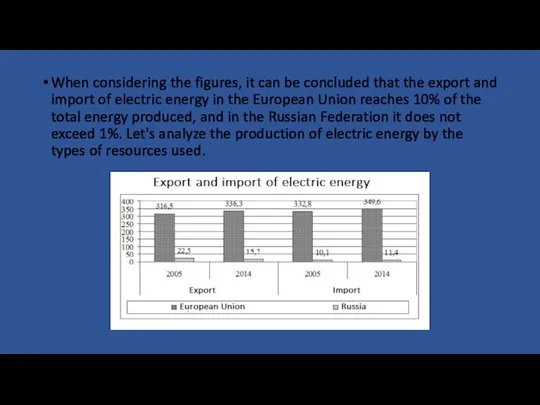
- 7. When considering the figures, it can be concluded that the export and import of electric energy
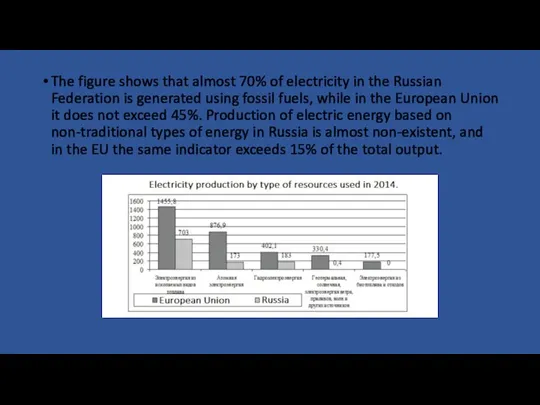
- 8. The figure shows that almost 70% of electricity in the Russian Federation is generated using fossil
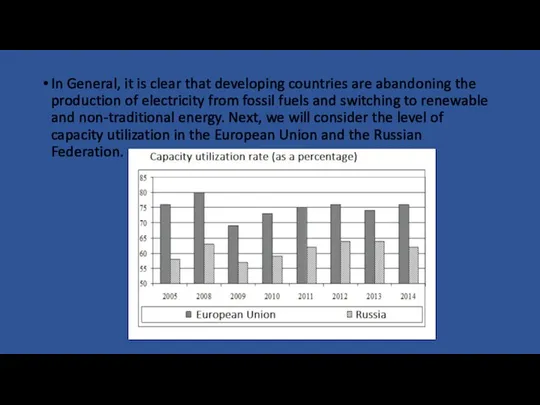
- 9. In General, it is clear that developing countries are abandoning the production of electricity from fossil
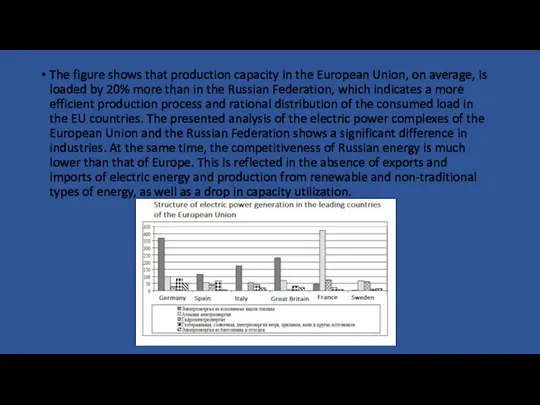
- 10. The figure shows that production capacity in the European Union, on average, is loaded by 20%
- 11. Result Thus, having conducted a comparative analysis of the electric power complexes of the European Union
- 13. Скачать презентацию
Слайд 3The Eurasian economic Union has taken the experience of the European Union
The Eurasian economic Union has taken the experience of the European Union
Слайд 4Within the framework of the Eurasian economic Union, three major agreements were
Within the framework of the Eurasian economic Union, three major agreements were
Слайд 5Consider the production of electricity in the Russian Federation and the European
Consider the production of electricity in the Russian Federation and the European
Слайд 6The figure shows that the electric power complex of the European Union
The figure shows that the electric power complex of the European Union
Слайд 7When considering the figures, it can be concluded that the export and
When considering the figures, it can be concluded that the export and
Слайд 8The figure shows that almost 70% of electricity in the Russian Federation
The figure shows that almost 70% of electricity in the Russian Federation
Слайд 9In General, it is clear that developing countries are abandoning the production
In General, it is clear that developing countries are abandoning the production
Слайд 10The figure shows that production capacity in the European Union, on average,
The figure shows that production capacity in the European Union, on average,
Слайд 11Result
Thus, having conducted a comparative analysis of the electric power complexes of
Result
Thus, having conducted a comparative analysis of the electric power complexes of
 Кубань - здравница России
 Страхование
 Драйверы перемен в российском менеджменте
 Феномен бюрократии в теории М. Вебера
 Природные катастрофы – всегда лиот нас ничего не зависит?
 Знатоки литературы
 Государство – основной институт политической системы
 Петербург театральный, музыкальный и мир кино ВТОРАЯ ПОЛОВИНА XIX ВЕКА
 История вычислительной техники
 Зоряне небо (1)
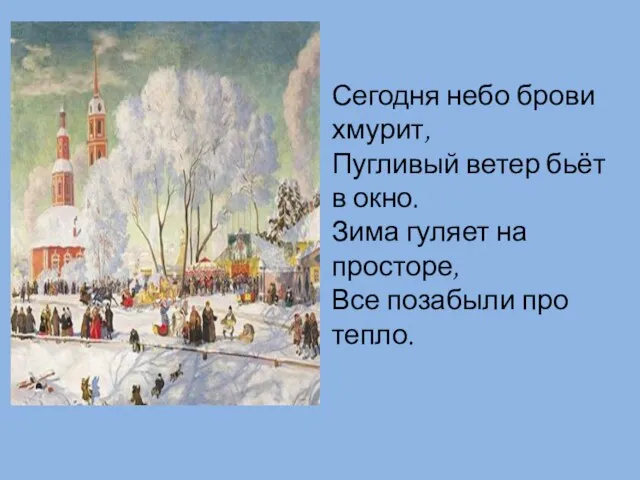 Сегодня небо брови хмурит, Пугливый ветер бьёт в окно. Зима гуляет на просторе, Все позабыли про тепло.
 Лидер на рынке услуг аутсорсинга
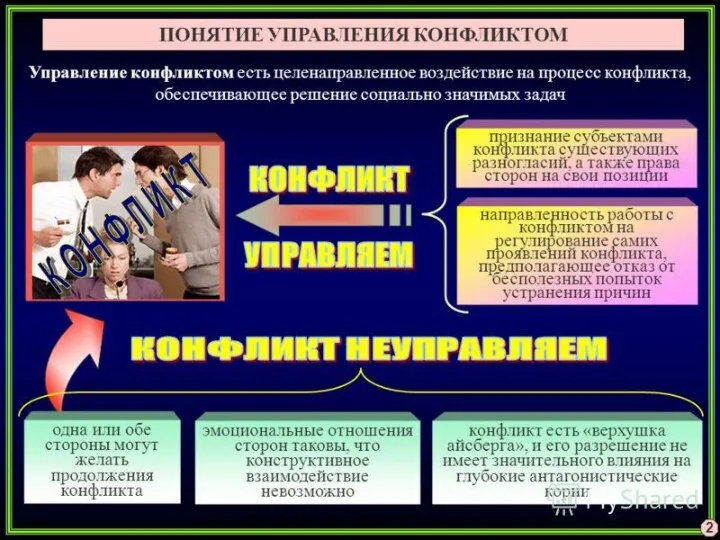 Разрешение конфликта
 Лобачевский Николай Иванович
 Робот для доставки
 Потому что котята портят мебель,гадят везде… Или просто много денег уходит на них.
 Родословная семьи Лисуновых
 Тема учебного проекта: Речевое дыхание
 Как понималось спасение в Ветхом Завете? Контуры ветхозаветной сотериологии Вячес
 Защищён ли иностранный инвестор в Украине? Правовые аспекты. Александра Павленко Советник по правовым вопросам Вице-премьер-минис
 О названиях некоторых блюд
 Тема педагогического совета: Формирование эмоционального настроя Эмоции расцвечивают жизнь человека, определяют степень
  ГАИШ МГУ
 Защита персональных данных – ждать или действовать ?
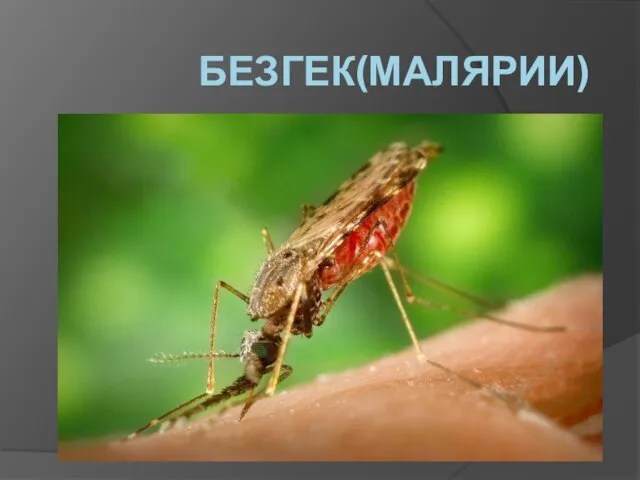 БЕЗГЕК(МАЛЯРИИ)
  День открытых дверей в гимназии
 Финно-угоры, ты и я
 Песок. Назначение и свойства