- GOODNESS OF FIT

Содержание
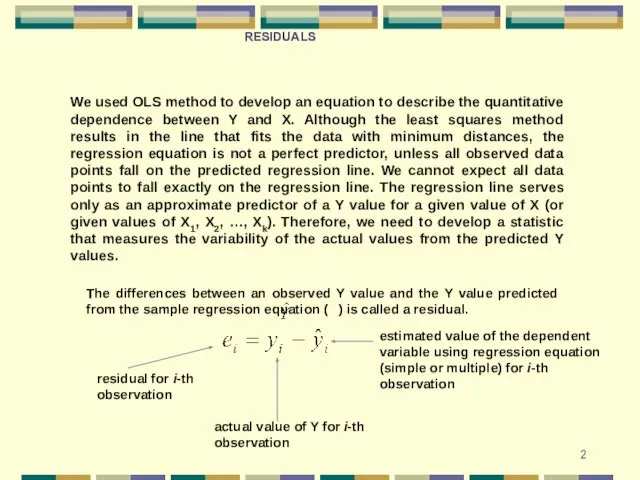
- 2. We used OLS method to develop an equation to describe the quantitative dependence between Y and
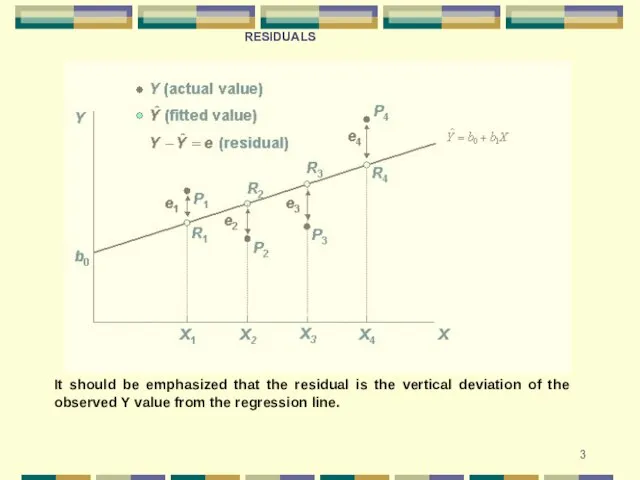
- 3. It should be emphasized that the residual is the vertical deviation of the observed Y value
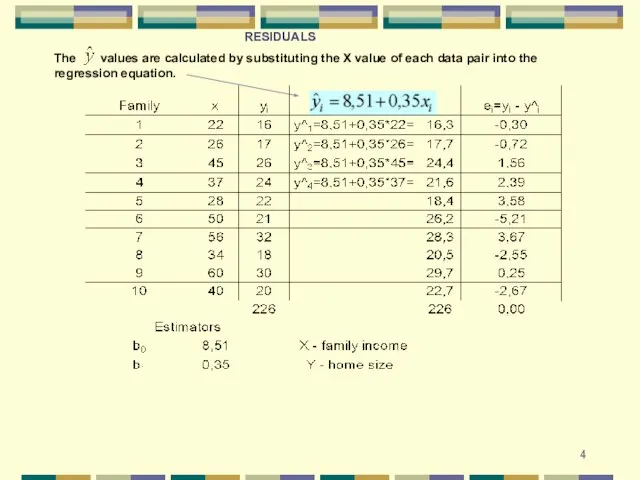
- 4. The values are calculated by substituting the X value of each data pair into the regression
- 5. RESIDUALS
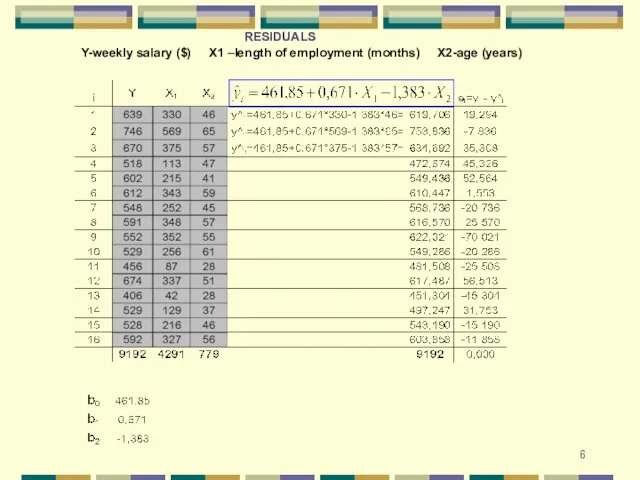
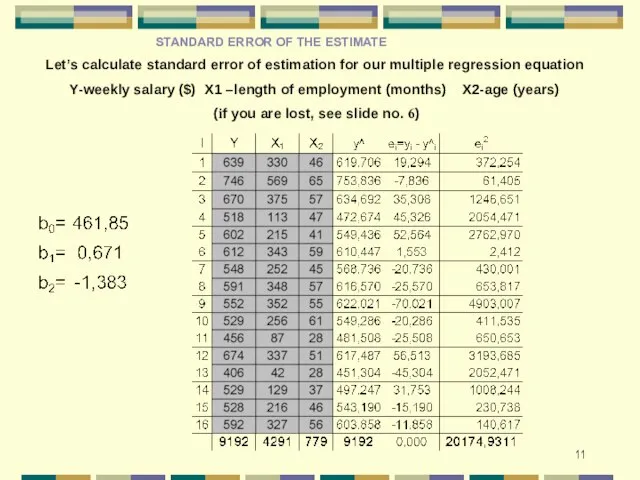
- 6. Y-weekly salary ($) X1 –length of employment (months) X2-age (years) RESIDUALS
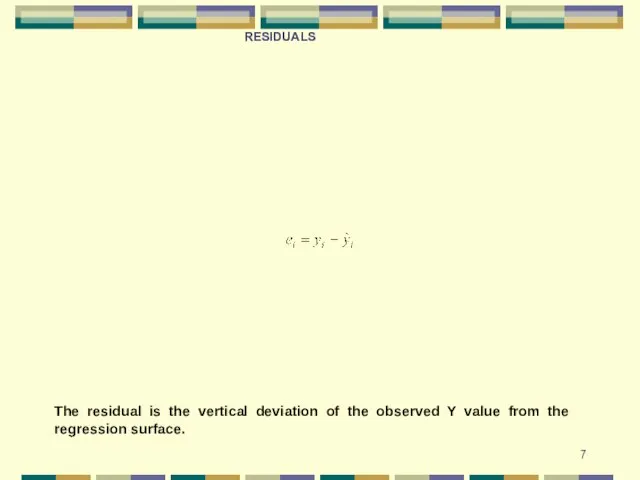
- 7. The residual is the vertical deviation of the observed Y value from the regression surface. RESIDUALS
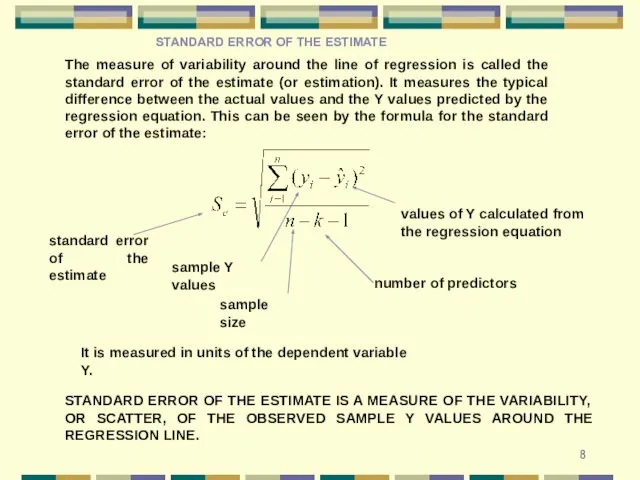
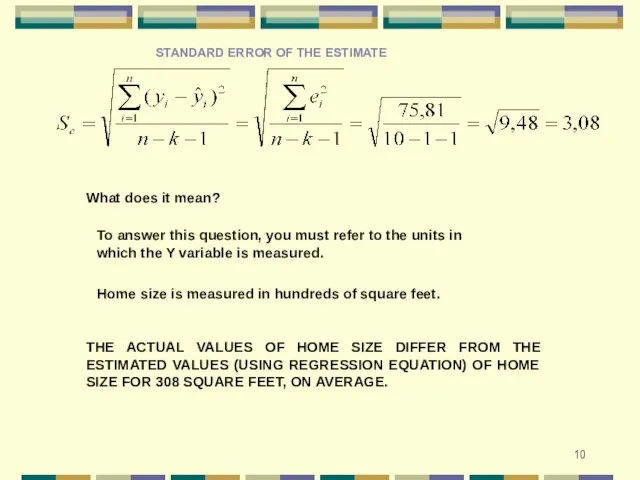
- 8. The measure of variability around the line of regression is called the standard error of the
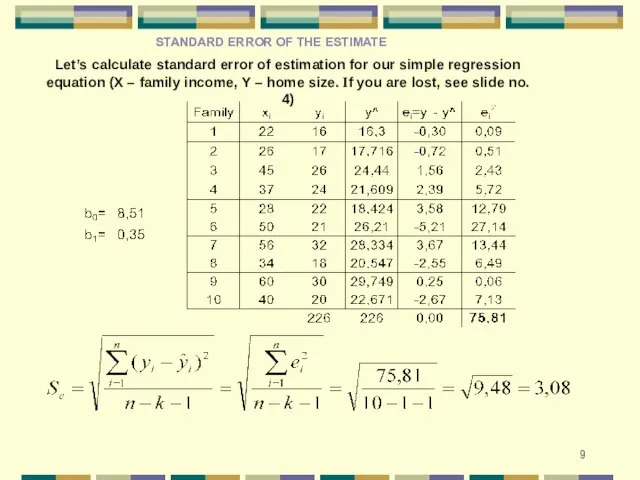
- 9. Let’s calculate standard error of estimation for our simple regression equation (X – family income, Y
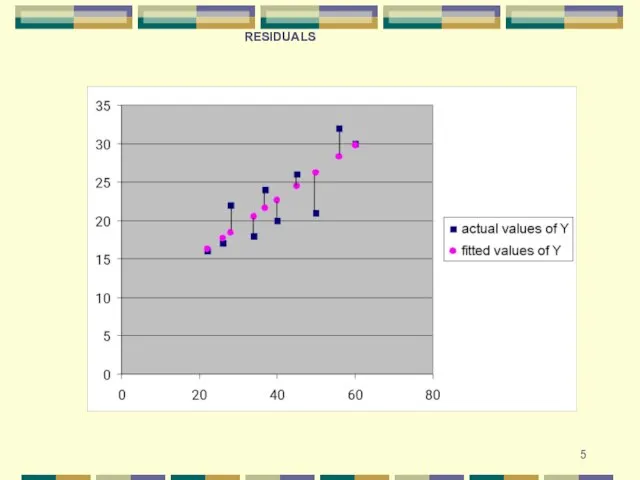
- 10. THE ACTUAL VALUES OF HOME SIZE DIFFER FROM THE ESTIMATED VALUES (USING REGRESSION EQUATION) OF HOME
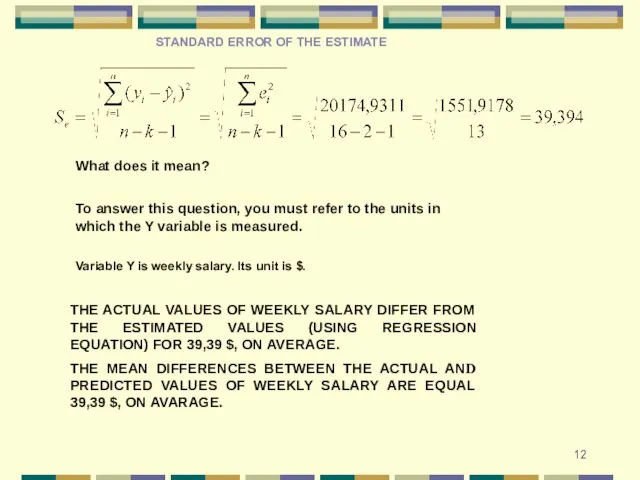
- 11. Let’s calculate standard error of estimation for our multiple regression equation Y-weekly salary ($) X1 –length
- 12. What does it mean? To answer this question, you must refer to the units in which
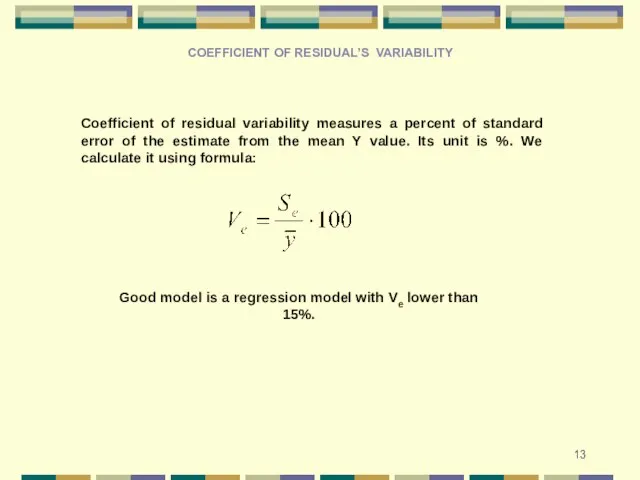
- 13. COEFFICIENT OF RESIDUAL’S VARIABILITY Coefficient of residual variability measures a percent of standard error of the
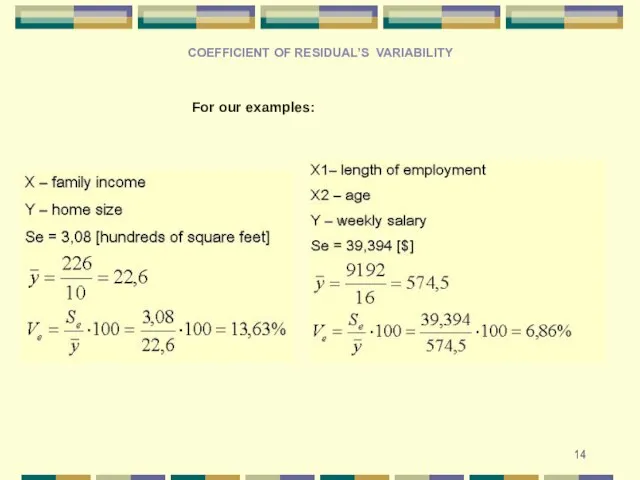
- 14. For our examples: COEFFICIENT OF RESIDUAL’S VARIABILITY
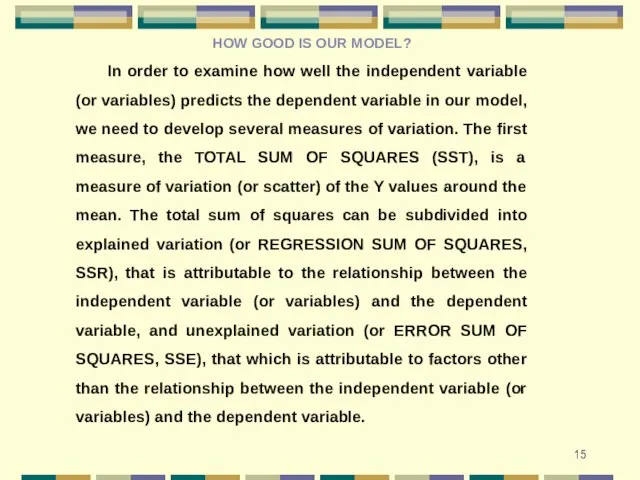
- 15. HOW GOOD IS OUR MODEL? In order to examine how well the independent variable (or variables)
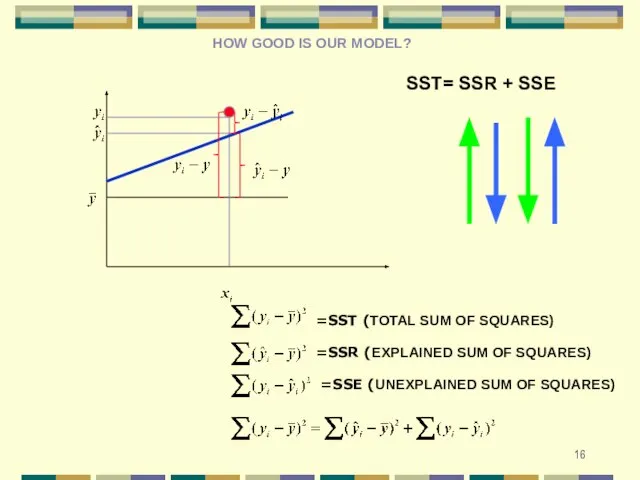
- 16. HOW GOOD IS OUR MODEL? SST= SSR + SSE =SST (TOTAL SUM OF SQUARES) =SSR (EXPLAINED
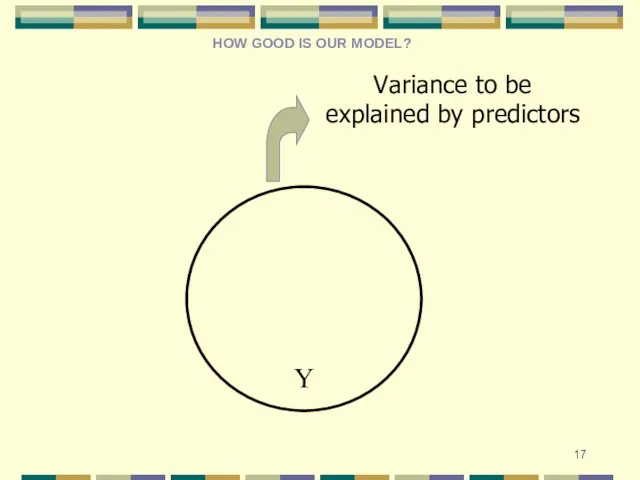
- 17. Y Variance to be explained by predictors HOW GOOD IS OUR MODEL?
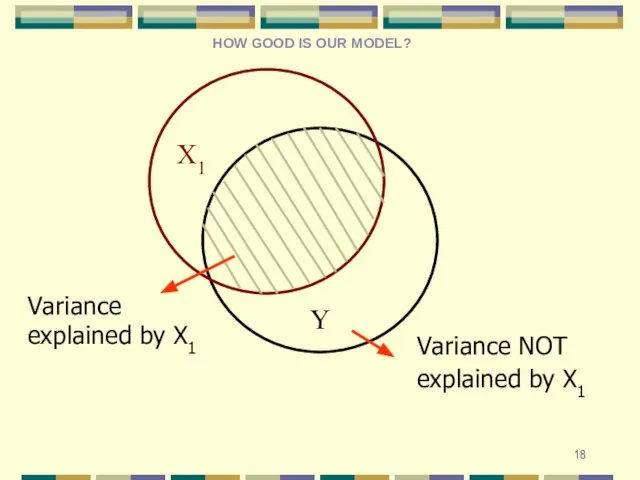
- 18. Y X1 Variance NOT explained by X1 Variance explained by X1 HOW GOOD IS OUR MODEL?
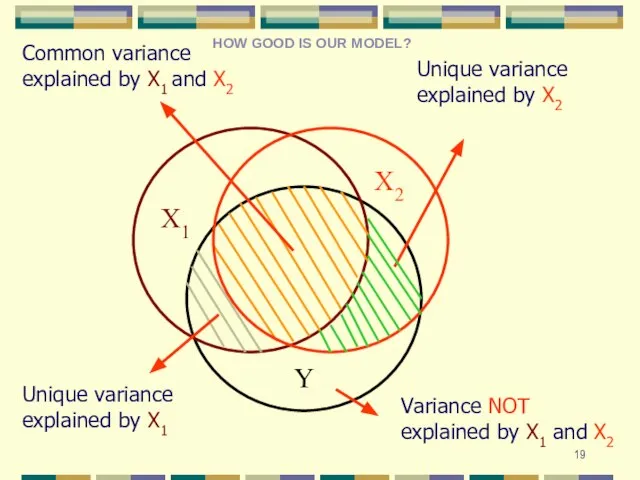
- 19. Y X1 Variance NOT explained by X1 and X2 Unique variance explained by X1 Unique variance
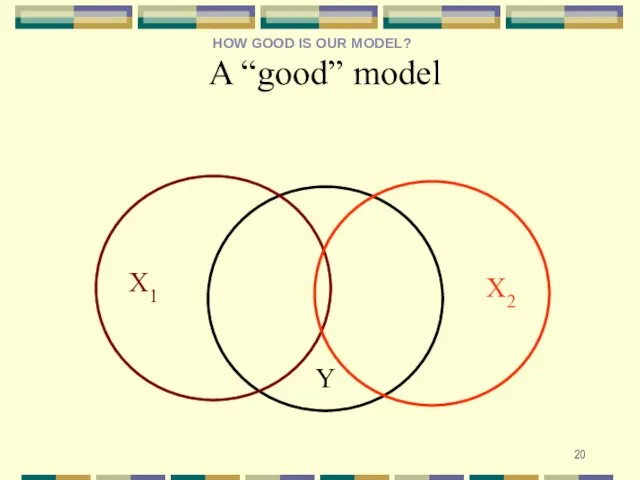
- 20. Y X1 X2 A “good” model HOW GOOD IS OUR MODEL?
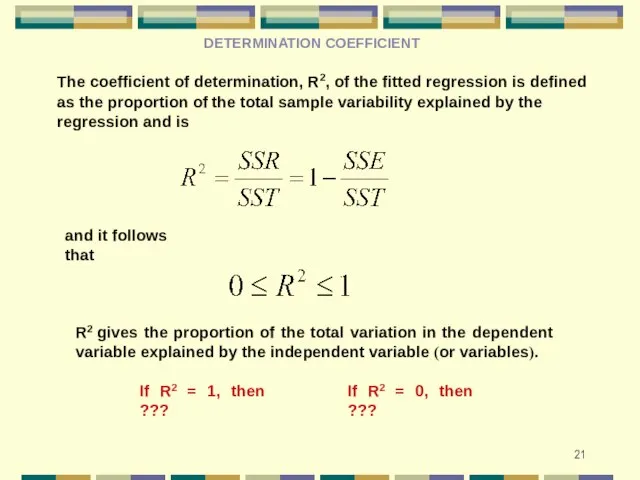
- 21. The coefficient of determination, R2, of the fitted regression is defined as the proportion of the
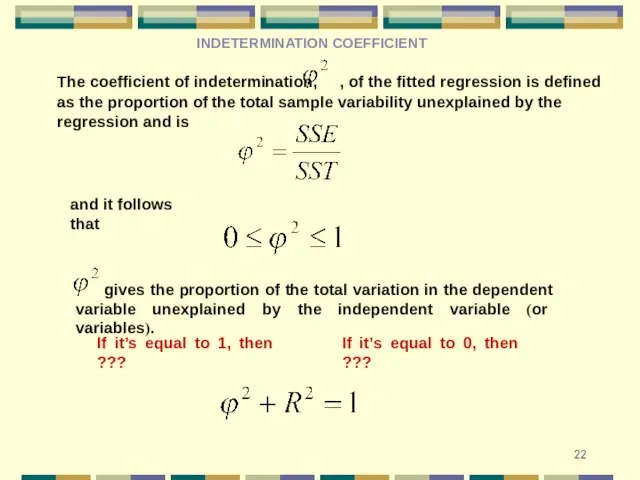
- 22. INDETERMINATION COEFFICIENT The coefficient of indetermination, , of the fitted regression is defined as the proportion
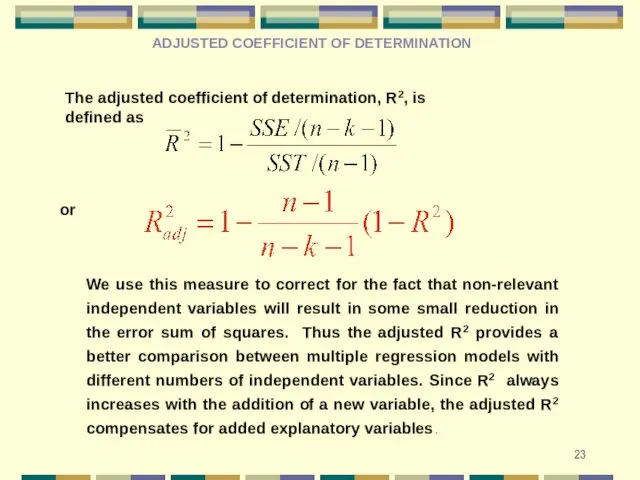
- 23. ADJUSTED COEFFICIENT OF DETERMINATION The adjusted coefficient of determination, R2, is defined as We use this
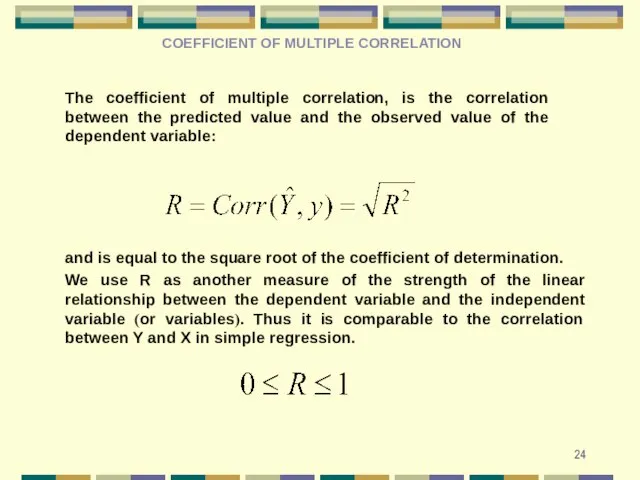
- 24. COEFFICIENT OF MULTIPLE CORRELATION The coefficient of multiple correlation, is the correlation between the predicted value
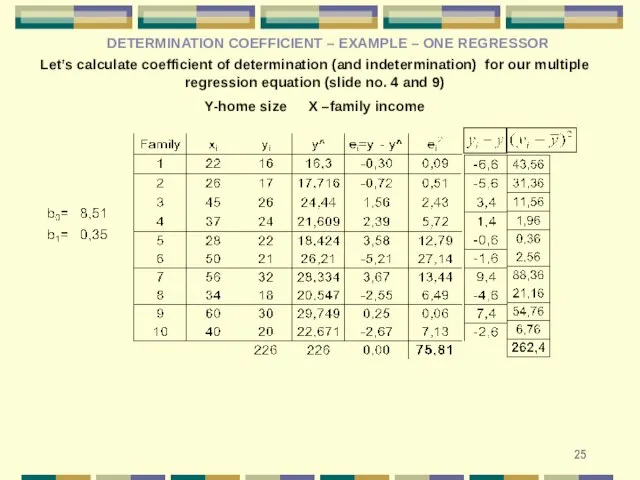
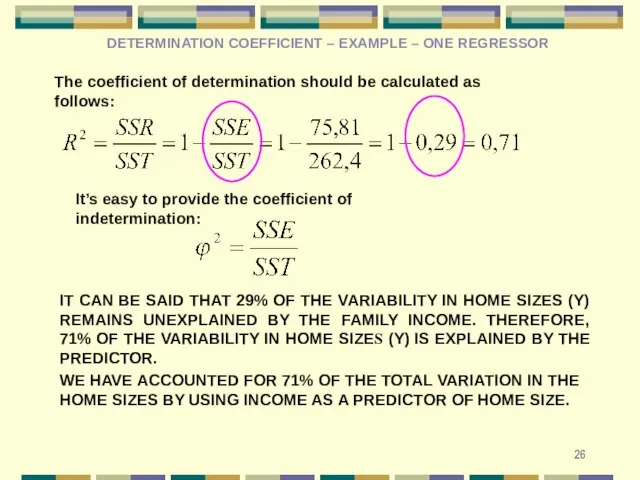
- 25. DETERMINATION COEFFICIENT – EXAMPLE – ONE REGRESSOR Let’s calculate coefficient of determination (and indetermination) for our
- 26. The coefficient of determination should be calculated as follows: It’s easy to provide the coefficient of
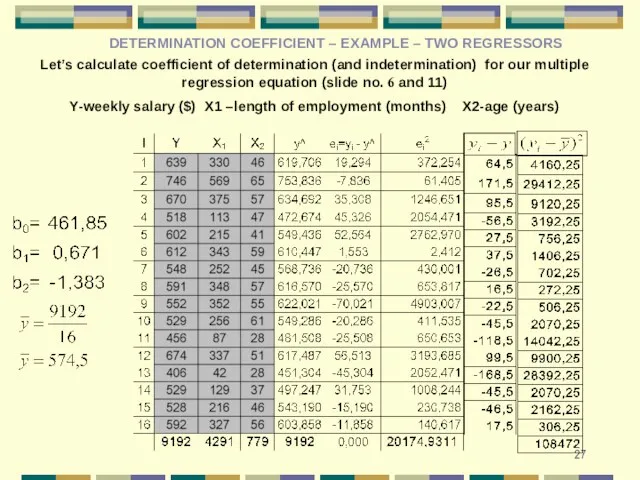
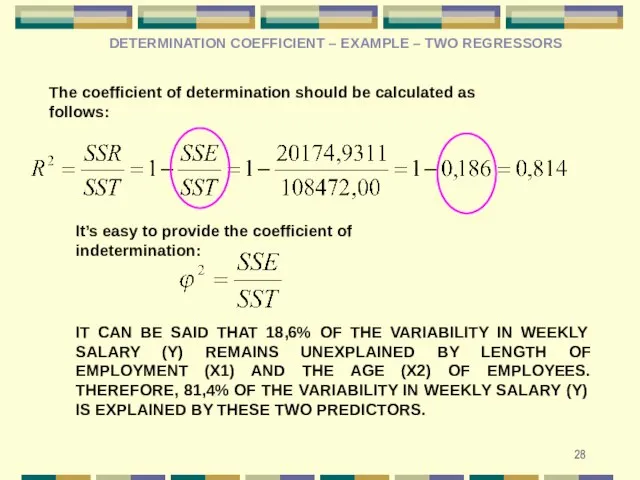
- 27. Let’s calculate coefficient of determination (and indetermination) for our multiple regression equation (slide no. 6 and
- 28. The coefficient of determination should be calculated as follows: It’s easy to provide the coefficient of
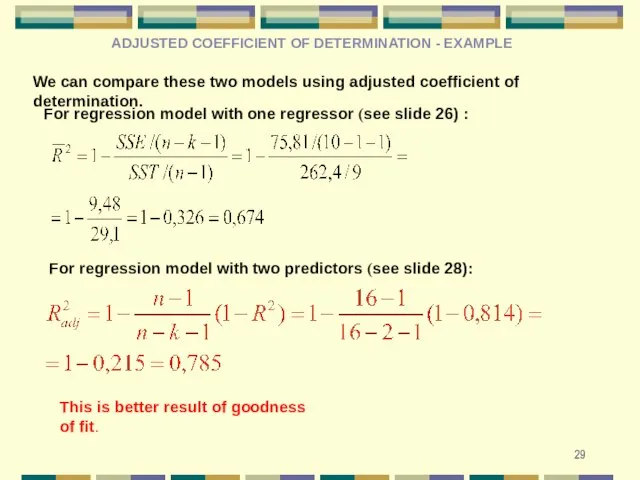
- 29. We can compare these two models using adjusted coefficient of determination. For regression model with one
- 31. Скачать презентацию
Слайд 3It should be emphasized that the residual is the vertical deviation of
It should be emphasized that the residual is the vertical deviation of
Слайд 4The values are calculated by substituting the X value of each data
The values are calculated by substituting the X value of each data
Слайд 5RESIDUALS
RESIDUALS
Слайд 6Y-weekly salary ($) X1 –length of employment (months) X2-age (years)
RESIDUALS
Y-weekly salary ($) X1 –length of employment (months) X2-age (years)
RESIDUALS
Слайд 7The residual is the vertical deviation of the observed Y value from
The residual is the vertical deviation of the observed Y value from
Слайд 8The measure of variability around the line of regression is called the
The measure of variability around the line of regression is called the
Слайд 9Let’s calculate standard error of estimation for our simple regression equation (X
Let’s calculate standard error of estimation for our simple regression equation (X
Слайд 10THE ACTUAL VALUES OF HOME SIZE DIFFER FROM THE ESTIMATED VALUES (USING
THE ACTUAL VALUES OF HOME SIZE DIFFER FROM THE ESTIMATED VALUES (USING
Слайд 11Let’s calculate standard error of estimation for our multiple regression equation
Y-weekly salary
Let’s calculate standard error of estimation for our multiple regression equation
Y-weekly salary
Слайд 12What does it mean?
To answer this question, you must refer to the
What does it mean?
To answer this question, you must refer to the
Слайд 13COEFFICIENT OF RESIDUAL’S VARIABILITY
Coefficient of residual variability measures a percent of standard
COEFFICIENT OF RESIDUAL’S VARIABILITY
Coefficient of residual variability measures a percent of standard
Слайд 14For our examples:
COEFFICIENT OF RESIDUAL’S VARIABILITY
For our examples:
COEFFICIENT OF RESIDUAL’S VARIABILITY
Слайд 15HOW GOOD IS OUR MODEL?
In order to examine how well the independent
HOW GOOD IS OUR MODEL?
In order to examine how well the independent
Слайд 16HOW GOOD IS OUR MODEL?
SST= SSR + SSE
=SST (TOTAL SUM OF SQUARES)
=SSR
HOW GOOD IS OUR MODEL?
SST= SSR + SSE
=SST (TOTAL SUM OF SQUARES)
=SSR
Слайд 17Y
Variance to be
explained by predictors
HOW GOOD IS OUR MODEL?
Y
Variance to be
explained by predictors
HOW GOOD IS OUR MODEL?
Слайд 18Y
X1
Variance NOT
explained by X1
Variance explained by X1
HOW GOOD IS OUR
Y
X1
Variance NOT
explained by X1
Variance explained by X1
HOW GOOD IS OUR
Слайд 19Y
X1
Variance NOT
explained by X1 and X2
Unique variance explained by X1
Unique variance
Y
X1
Variance NOT
explained by X1 and X2
Unique variance explained by X1
Unique variance
Слайд 20Y
X1
X2
A “good” model
HOW GOOD IS OUR MODEL?
Y
X1
X2
A “good” model
HOW GOOD IS OUR MODEL?
Слайд 21 The coefficient of determination, R2, of the fitted regression is defined as
The coefficient of determination, R2, of the fitted regression is defined as
Слайд 22INDETERMINATION COEFFICIENT
The coefficient of indetermination, , of the fitted regression is defined
INDETERMINATION COEFFICIENT
The coefficient of indetermination, , of the fitted regression is defined
Слайд 23ADJUSTED COEFFICIENT OF DETERMINATION
The adjusted coefficient of determination, R2, is defined as
We
ADJUSTED COEFFICIENT OF DETERMINATION
The adjusted coefficient of determination, R2, is defined as
We
Слайд 24COEFFICIENT OF MULTIPLE CORRELATION
The coefficient of multiple correlation, is the correlation between
COEFFICIENT OF MULTIPLE CORRELATION
The coefficient of multiple correlation, is the correlation between
Слайд 25DETERMINATION COEFFICIENT – EXAMPLE – ONE REGRESSOR
Let’s calculate coefficient of determination (and
DETERMINATION COEFFICIENT – EXAMPLE – ONE REGRESSOR
Let’s calculate coefficient of determination (and
Слайд 26The coefficient of determination should be calculated as follows:
It’s easy to provide
The coefficient of determination should be calculated as follows:
It’s easy to provide
Слайд 27Let’s calculate coefficient of determination (and indetermination) for our multiple regression equation
Let’s calculate coefficient of determination (and indetermination) for our multiple regression equation
Слайд 28The coefficient of determination should be calculated as follows:
It’s easy to provide
The coefficient of determination should be calculated as follows:
It’s easy to provide
Слайд 29We can compare these two models using adjusted coefficient of determination.
For
We can compare these two models using adjusted coefficient of determination.
For
 Использование ИКТ в образовательном процессе как способ оптимизации деятельности учителя
 Психология зависимого поведения
 ПРЕЗЕНТАЦИЯ МОИХ РАБОТ«ВРЕМЕНА ГОДА»
 Рак почки. Эпидемиология, классификация, этиология, патогенез, клиническая картина
 Dmitry Sergeyevich Likhachov
 Вопрос о правде в драме М.Горького «На дне».
 Информационно-справочная система Предприятие средств диспетчерского и технологического управления РУП Гродноэнерго
 Презентация на тему Албания
  Мониторинг и оценкав деятельности НКО
 Научно-методические основы корректировочного курса по русскому языку как неродному(глагольное предложное управление в азербай
 Педагогический meet-up Начать легко
 Наше Сердце.
 Презентация на тему ОЛИМПИАДА 2014 г. СОЧИ
  Соединение деталей шурупами
 Подготовка документов для создания организации
 Фундаментальные и прикладные вопросы нейробиологии
 Литература Древнего Египта
 ТЕХНИЧЕСКОЕ ЗАДАНИЕ
 Презентация на тему Жизненный цикл клетки. Митоз. Амитоз
 Мир художественной культуры эпохи Возрождения
 Сервис 1С-Товары
 House
House Этиология и распространенность наркологических заболеваний
 Ноябрь 18 - соок-ирей кырган-ачавыстыӊ төрүттүнген хүнү болур, уруглар
 Экипаж. Отечественное кино
 Л.С. Выготский о законах личностного развития
 Find 1 word for 3 pictures
 01.09.20121 3 «ПОСЛЕДНИЙ ДЕНЬ ПЕРЕД РОЖДЕСТВОМ ПРОШЁЛ.ЗИМНЯЯ, ЯСНАЯ НОЧЬ НАСТУПИЛА. ГЛЯНУЛИ ЗВЁЗДЫ.»