- Market Analysis for Shopping Centers Demand, Supply

Содержание
- 2. Market Analysis Process Step 1: Define the Product (property productivity analysis) Step 2: Define users of
- 3. Step 1: Define the Product (Property Productivity Analysis) Site and Building Analysis Location Analysis land use
- 4. Step 2: Define users of the Property and Trade Area (Market Delineation) Trade Area Circles Identify
- 5. Step 3: Forecast Demand Factors Population and Households Forecast number of households in trade area Population
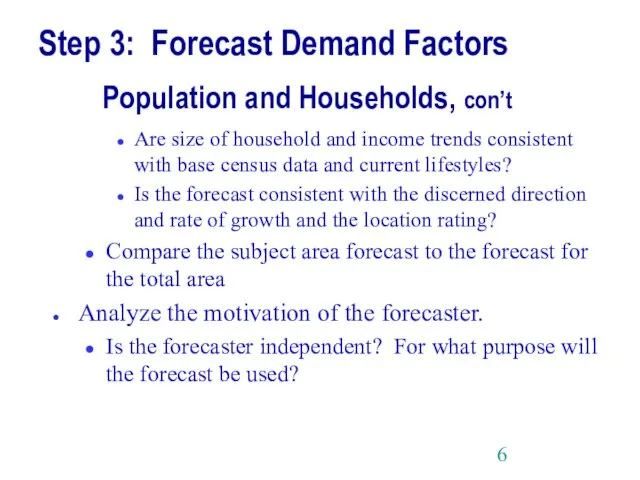
- 6. Step 3: Forecast Demand Factors Population and Households, con’t Are size of household and income trends
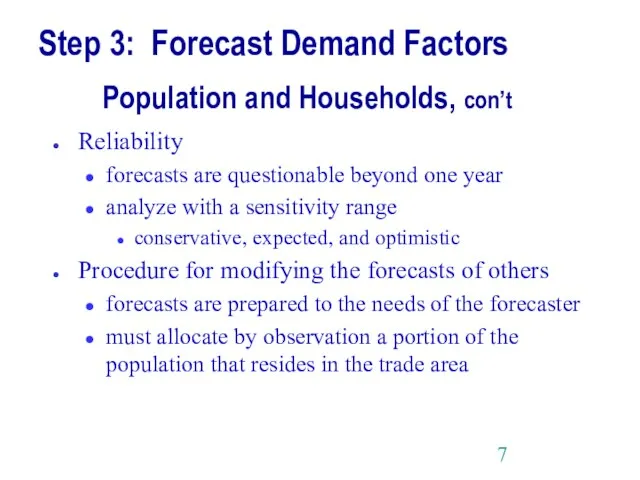
- 7. Step 3: Forecast Demand Factors Population and Households, con’t Reliability forecasts are questionable beyond one year
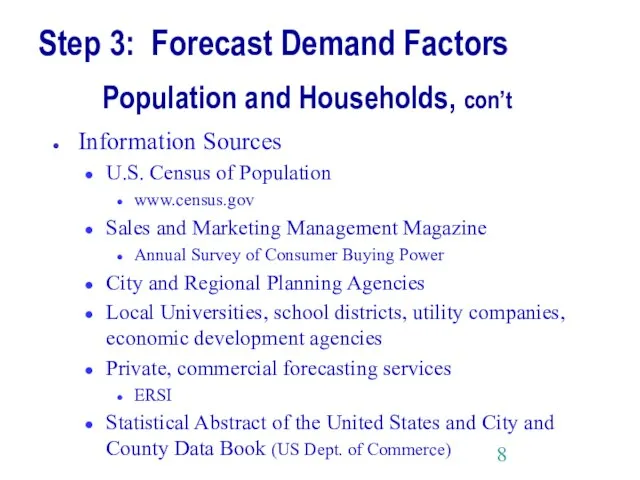
- 8. Step 3: Forecast Demand Factors Population and Households, con’t Information Sources U.S. Census of Population www.census.gov
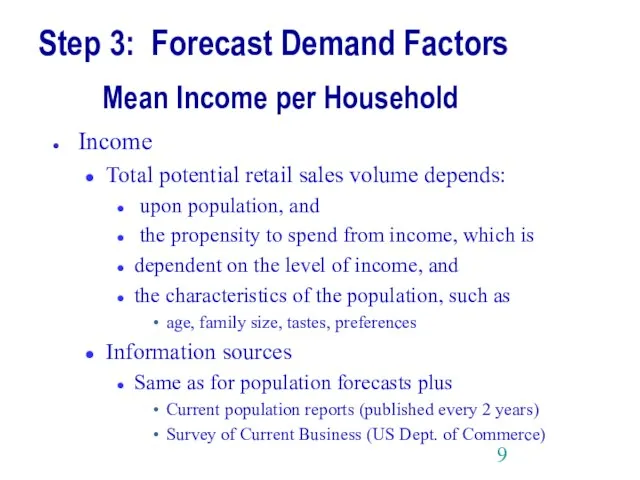
- 9. Step 3: Forecast Demand Factors Mean Income per Household Income Total potential retail sales volume depends:
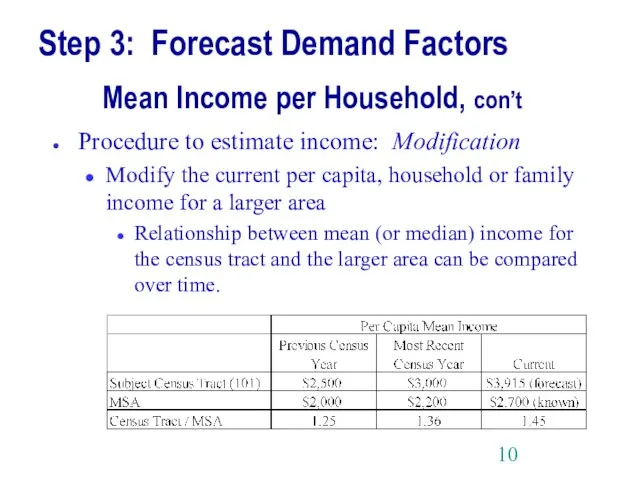
- 10. Step 3: Forecast Demand Factors Mean Income per Household, con’t Procedure to estimate income: Modification Modify
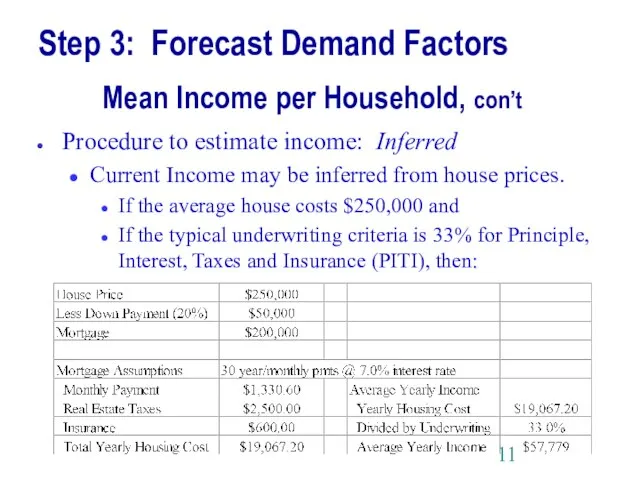
- 11. Step 3: Forecast Demand Factors Mean Income per Household, con’t Procedure to estimate income: Inferred Current
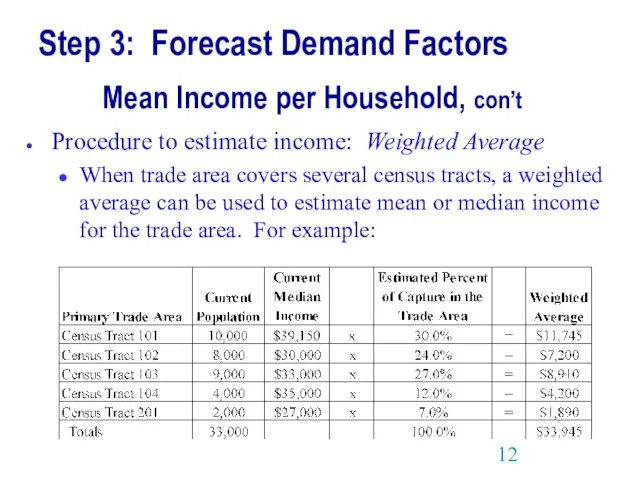
- 12. Step 3: Forecast Demand Factors Mean Income per Household, con’t Procedure to estimate income: Weighted Average
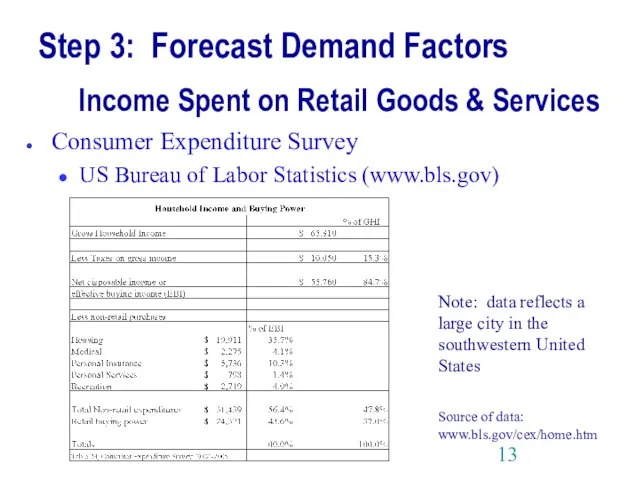
- 13. Step 3: Forecast Demand Factors Income Spent on Retail Goods & Services Consumer Expenditure Survey US
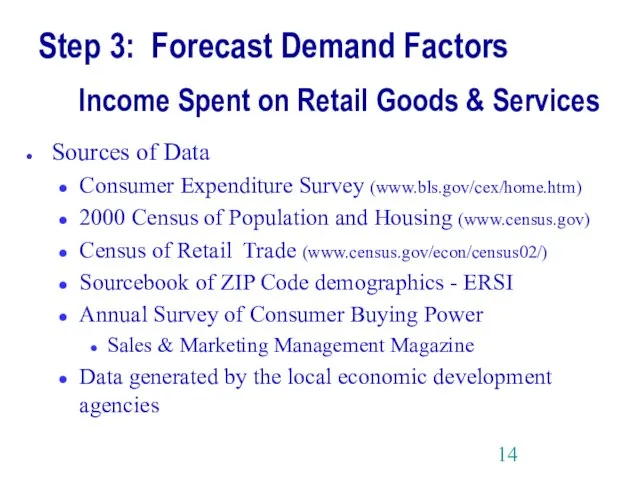
- 14. Step 3: Forecast Demand Factors Income Spent on Retail Goods & Services Sources of Data Consumer
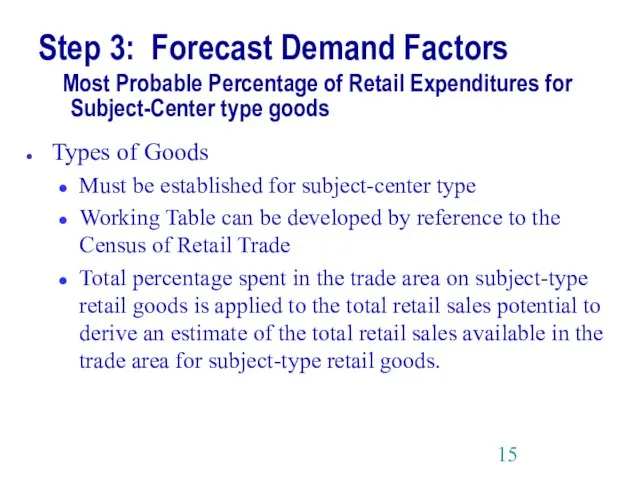
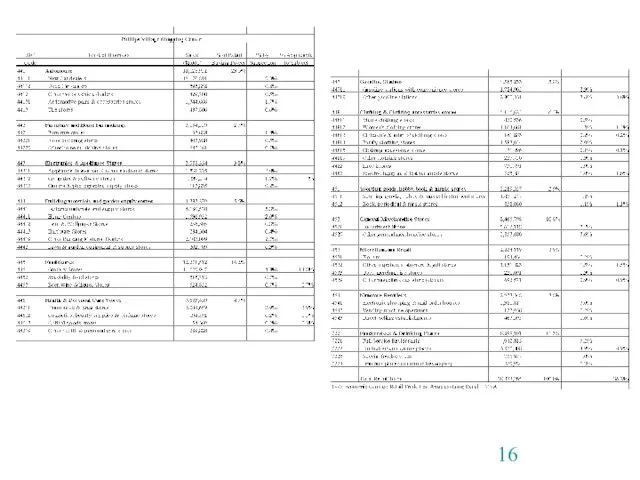
- 15. Step 3: Forecast Demand Factors Most Probable Percentage of Retail Expenditures for Subject-Center type goods Types
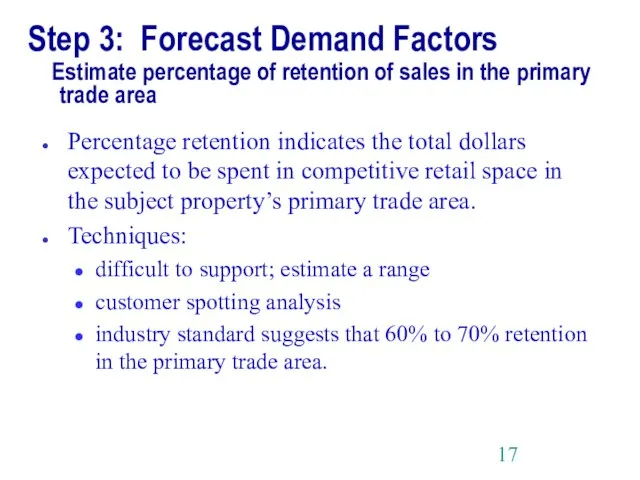
- 17. Step 3: Forecast Demand Factors Estimate percentage of retention of sales in the primary trade area
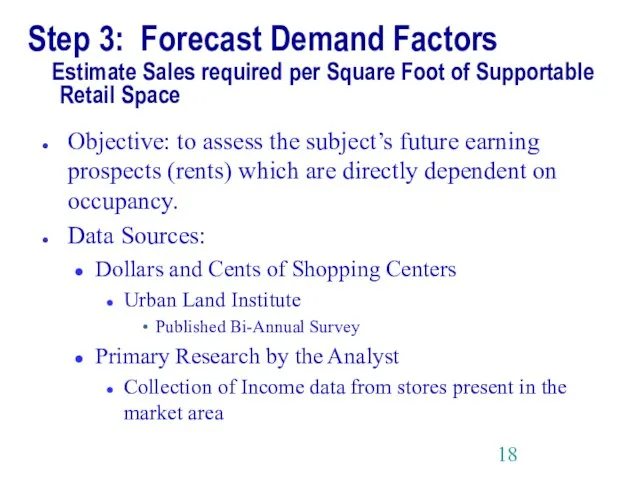
- 18. Step 3: Forecast Demand Factors Estimate Sales required per Square Foot of Supportable Retail Space Objective:
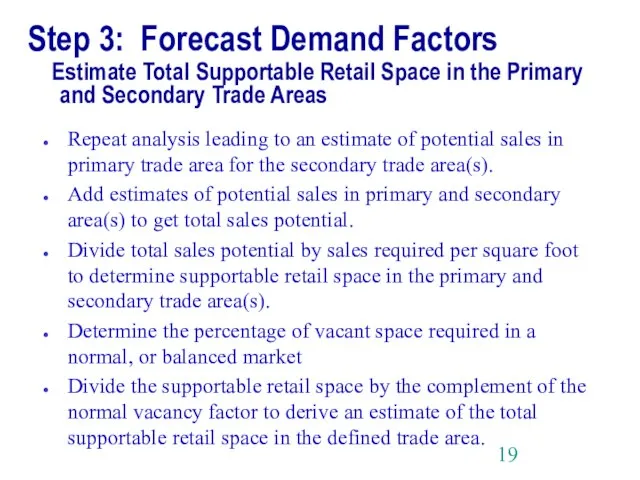
- 19. Step 3: Forecast Demand Factors Estimate Total Supportable Retail Space in the Primary and Secondary Trade
- 21. Step 4: Inventory and Forecast Competitive Supply Purpose Catalogue all current and potential space competing for
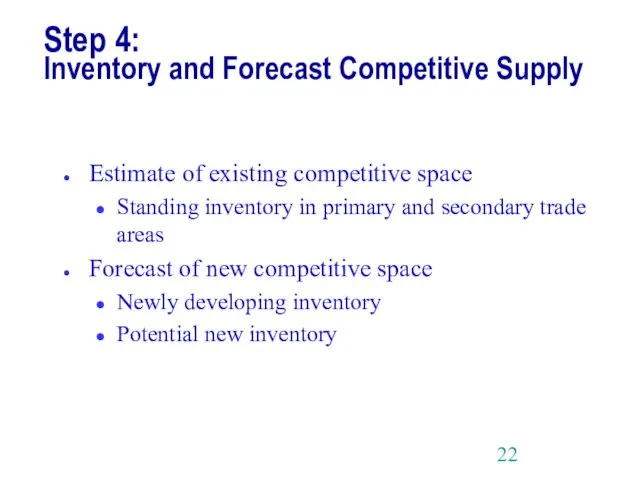
- 22. Step 4: Inventory and Forecast Competitive Supply Estimate of existing competitive space Standing inventory in primary
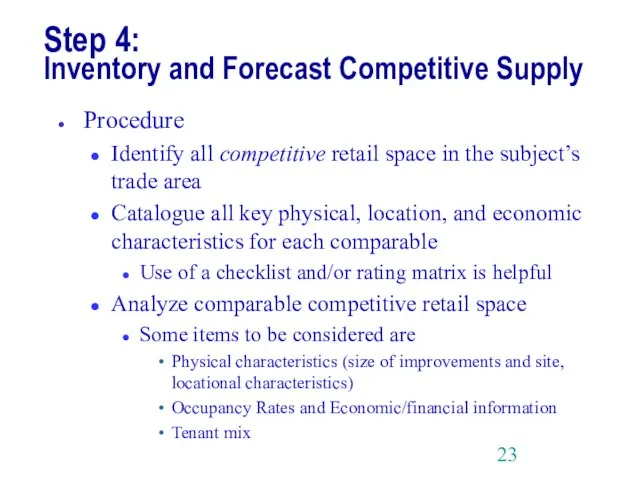
- 23. Step 4: Inventory and Forecast Competitive Supply Procedure Identify all competitive retail space in the subject’s
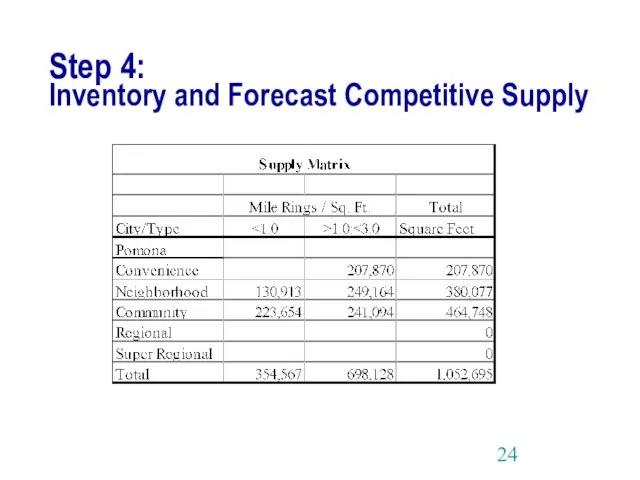
- 24. Step 4: Inventory and Forecast Competitive Supply
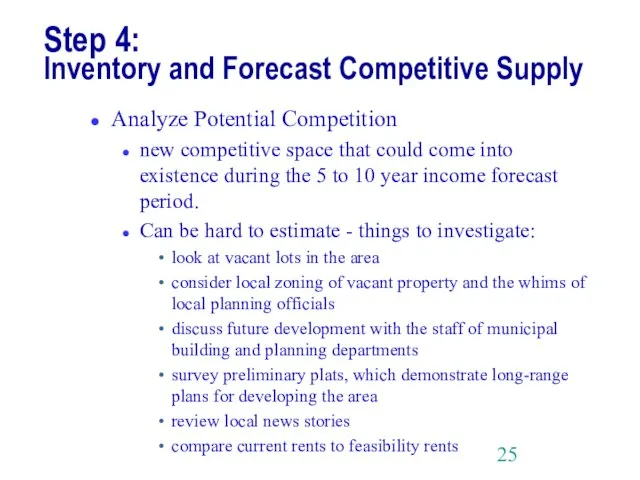
- 25. Step 4: Inventory and Forecast Competitive Supply Analyze Potential Competition new competitive space that could come
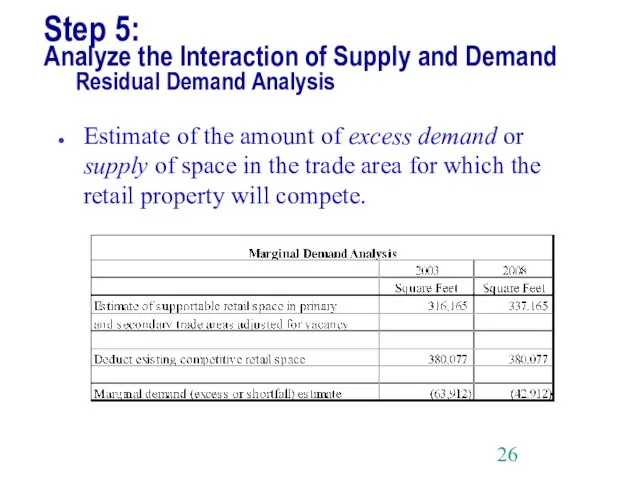
- 26. Step 5: Analyze the Interaction of Supply and Demand Residual Demand Analysis Estimate of the amount
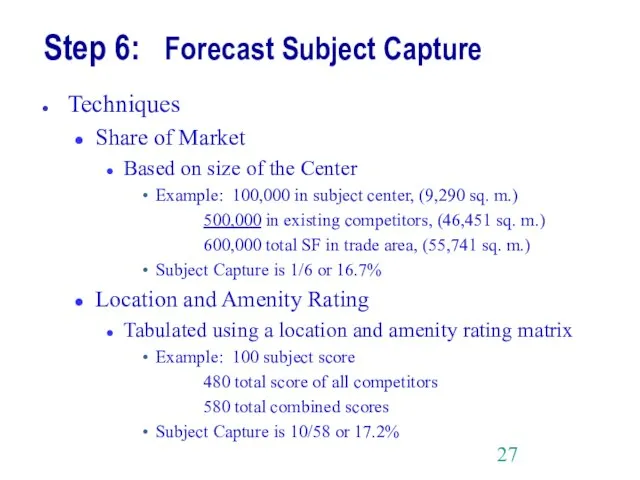
- 27. Step 6: Forecast Subject Capture Techniques Share of Market Based on size of the Center Example:
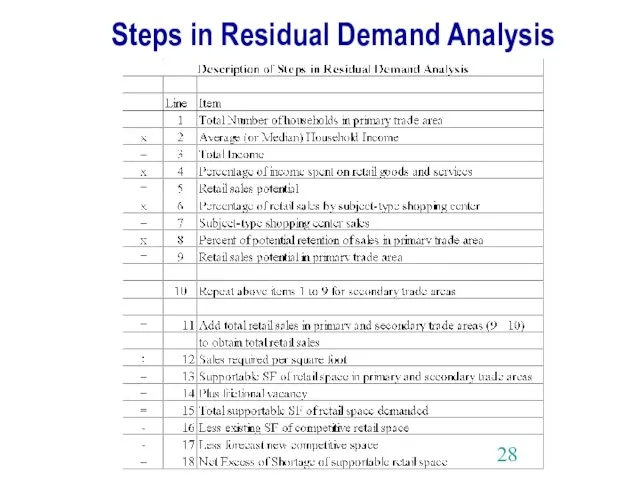
- 28. Steps in Residual Demand Analysis
- 30. Скачать презентацию
Слайд 2Market Analysis Process
Step 1: Define the Product (property productivity analysis)
Step 2: Define
Market Analysis Process
Step 1: Define the Product (property productivity analysis)
Step 2: Define
Слайд 3Step 1: Define the Product
(Property Productivity Analysis)
Site and Building Analysis
Location Analysis
land
Step 1: Define the Product
(Property Productivity Analysis)
Site and Building Analysis
Location Analysis
land
Слайд 4Step 2: Define users of the Property
and Trade Area (Market Delineation)
Trade
Step 2: Define users of the Property
and Trade Area (Market Delineation)
Trade
Слайд 5Step 3: Forecast Demand Factors
Population and Households
Forecast number of households in trade
Step 3: Forecast Demand Factors
Population and Households
Forecast number of households in trade
Слайд 6Step 3: Forecast Demand Factors
Population and Households, con’t
Are size of household and
Step 3: Forecast Demand Factors
Population and Households, con’t
Are size of household and
Слайд 7Step 3: Forecast Demand Factors
Population and Households, con’t
Reliability
forecasts are questionable beyond one
Step 3: Forecast Demand Factors
Population and Households, con’t
Reliability
forecasts are questionable beyond one
Слайд 8Step 3: Forecast Demand Factors
Population and Households, con’t
Information Sources
U.S. Census of Population
www.census.gov
Sales
Step 3: Forecast Demand Factors
Population and Households, con’t
Information Sources
U.S. Census of Population
www.census.gov
Sales
Слайд 9Step 3: Forecast Demand Factors
Mean Income per Household
Income
Total potential retail sales volume
Step 3: Forecast Demand Factors
Mean Income per Household
Income
Total potential retail sales volume
Слайд 10Step 3: Forecast Demand Factors
Mean Income per Household, con’t
Procedure to estimate income:
Step 3: Forecast Demand Factors
Mean Income per Household, con’t
Procedure to estimate income:
Слайд 11Step 3: Forecast Demand Factors
Mean Income per Household, con’t
Procedure to estimate income:
Step 3: Forecast Demand Factors
Mean Income per Household, con’t
Procedure to estimate income:
Слайд 12Step 3: Forecast Demand Factors
Mean Income per Household, con’t
Procedure to estimate income:
Step 3: Forecast Demand Factors
Mean Income per Household, con’t
Procedure to estimate income:
Слайд 13Step 3: Forecast Demand Factors
Income Spent on Retail Goods & Services
Consumer
Step 3: Forecast Demand Factors
Income Spent on Retail Goods & Services
Consumer
Слайд 14Step 3: Forecast Demand Factors
Income Spent on Retail Goods & Services
Sources
Step 3: Forecast Demand Factors
Income Spent on Retail Goods & Services
Sources
Слайд 15Step 3: Forecast Demand Factors
Most Probable Percentage of Retail Expenditures for
Step 3: Forecast Demand Factors Most Probable Percentage of Retail Expenditures for
Слайд 17Step 3: Forecast Demand Factors
Estimate percentage of retention of sales in
Step 3: Forecast Demand Factors Estimate percentage of retention of sales in
Слайд 18Step 3: Forecast Demand Factors
Estimate Sales required per Square Foot of
Step 3: Forecast Demand Factors Estimate Sales required per Square Foot of
Слайд 19Step 3: Forecast Demand Factors
Estimate Total Supportable Retail Space in the
Step 3: Forecast Demand Factors Estimate Total Supportable Retail Space in the
Слайд 21Step 4:
Inventory and Forecast Competitive Supply
Purpose
Catalogue all current and potential space competing
Step 4:
Inventory and Forecast Competitive Supply
Purpose
Catalogue all current and potential space competing
Слайд 22Step 4:
Inventory and Forecast Competitive Supply
Estimate of existing competitive space
Standing inventory in
Step 4:
Inventory and Forecast Competitive Supply
Estimate of existing competitive space
Standing inventory in
Слайд 23Step 4:
Inventory and Forecast Competitive Supply
Procedure
Identify all competitive retail space in the
Step 4:
Inventory and Forecast Competitive Supply
Procedure
Identify all competitive retail space in the
Слайд 24Step 4:
Inventory and Forecast Competitive Supply
Step 4:
Inventory and Forecast Competitive Supply
Слайд 25Step 4:
Inventory and Forecast Competitive Supply
Analyze Potential Competition
new competitive space that could
Step 4:
Inventory and Forecast Competitive Supply
Analyze Potential Competition
new competitive space that could
Слайд 26Step 5:
Analyze the Interaction of Supply and Demand
Residual Demand Analysis
Estimate of the
Step 5:
Analyze the Interaction of Supply and Demand
Residual Demand Analysis
Estimate of the
Слайд 27Step 6: Forecast Subject Capture
Techniques
Share of Market
Based on size of the Center
Example:
Step 6: Forecast Subject Capture
Techniques
Share of Market
Based on size of the Center
Example:
Слайд 28Steps in Residual Demand Analysis
Steps in Residual Demand Analysis
 Анимализм. Рисуем волка поэтапно
 Презентация на тему ЛЕТОПИСИ ЛЕТОПИСЦЫ ЗЕМЛИ РУССКОЙ
  Практикум-исследование. Высшее или среднее образование
 Имя числительное как часть речи
 Задание 2
 Как попасть в страну Филологию?
 Платья-корсаж. Разработка и изготовление
 Мягкий знак на конце существительных после шипящих
 Мониторинг как инструмент оценки качества образовательных результатов учащихся
 Презентация Илларионоа Ивана Руководитель Погодина И.П. Школа искусств СОШ № 54 г. Чебоксары, 2009 г.
 28.01 Триг уравнения
 Предпринимательская экосистемаПермь
 Исследовательская работа на уроках математики
 Всероссийский экспертный педагогический совет
 Чистая вода – источник жизниОтчет ТОО «Водные ресурсы-Маркетинг» по предоставлению услуг водоснабжения и водоотведения за 2010 г
 Современное декоративное искусство. 5 класс
 Третичный сектор хозяйства
 Все работы хороши, выбирай на вкус!
 Китч. Китч в живописи. Китч в интерьерах
 Ультразвуковой отпугиватель комаров. Исследовательский проект
 Социальная политика – основа обеспечения стабильности и безопасности в обществе
 Презентация на тему Системы счисления
  Мировая экономика: характеристика, механизм, этапы и тенденции развития
 День Героев Отечества
 Правонарушение и юр отв-ть
 Храмов Сергей МихайловичЛАТЕНТНАЯ ПРЕСТУПНОСТЬ:МЕТОДОЛОГИЯ ПОЗНАНИЯ И ОСНОВНЫЕ НАПРАВЛЕНИЯ ПРОТИВОДЕЙСТВИЯ
 Презентация на тему Средняя линия трапеции
 Для пятиклассников