- GROWTH AND GROWTH POLICY

Содержание
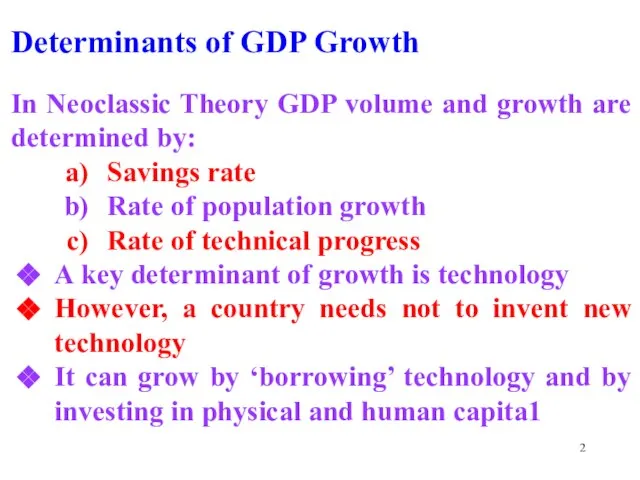
- 2. Determinants of GDP Growth In Neoclassic Theory GDP volume and growth are determined by: Savings rate
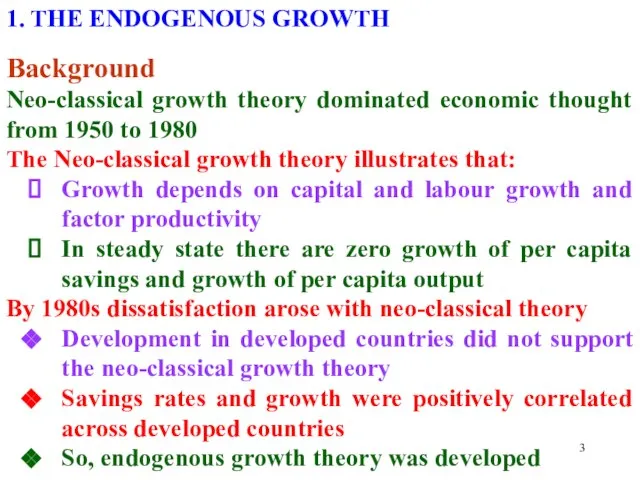
- 3. 1. THE ENDOGENOUS GROWTH Background Neo-classical growth theory dominated economic thought from 1950 to 1980 The
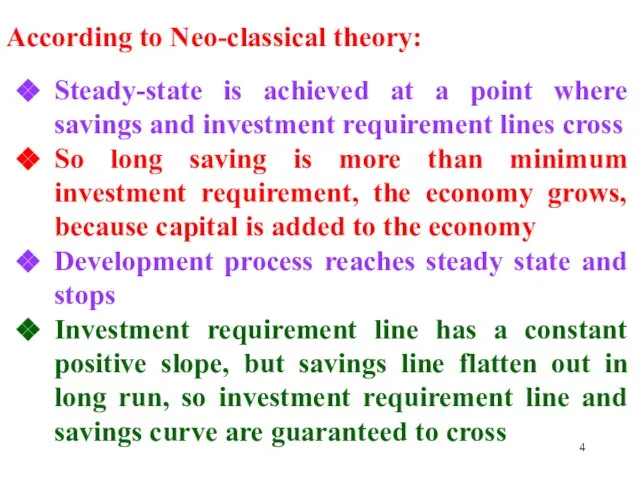
- 4. According to Neo-classical theory: Steady-state is achieved at a point where savings and investment requirement lines
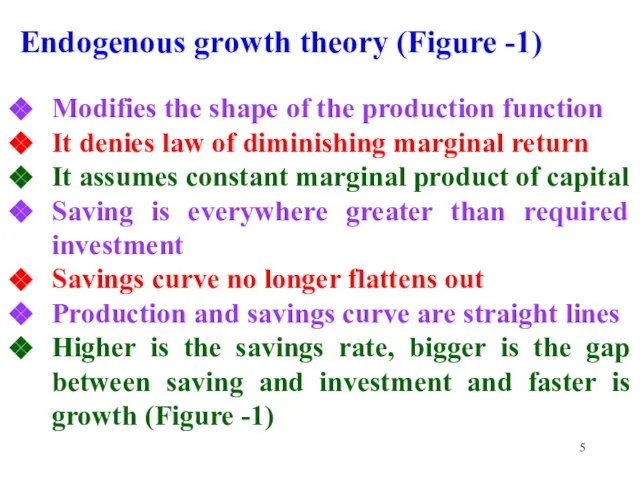
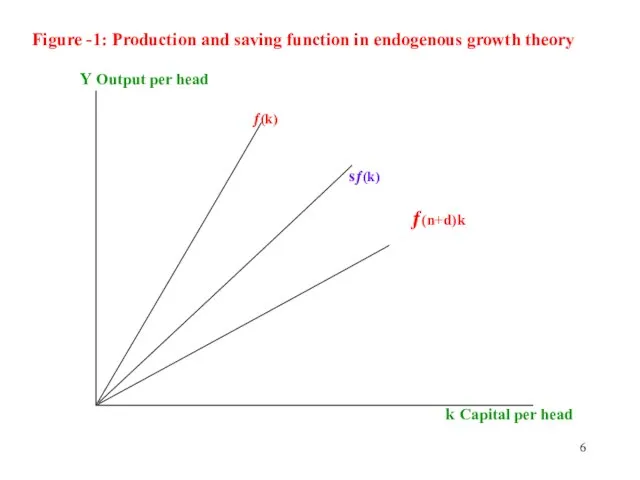
- 5. Endogenous growth theory (Figure -1) Modifies the shape of the production function It denies law of
- 6. Figure -1: Production and saving function in endogenous growth theory Y Output per head ƒ(k) sƒ(k)
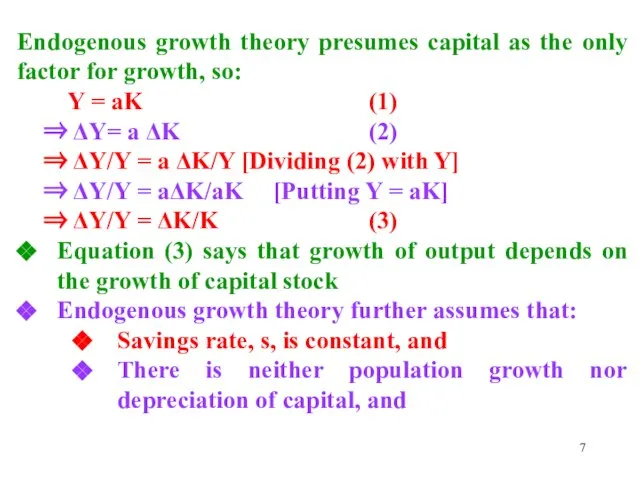
- 7. Endogenous growth theory presumes capital as the only factor for growth, so: Y = aK (1)
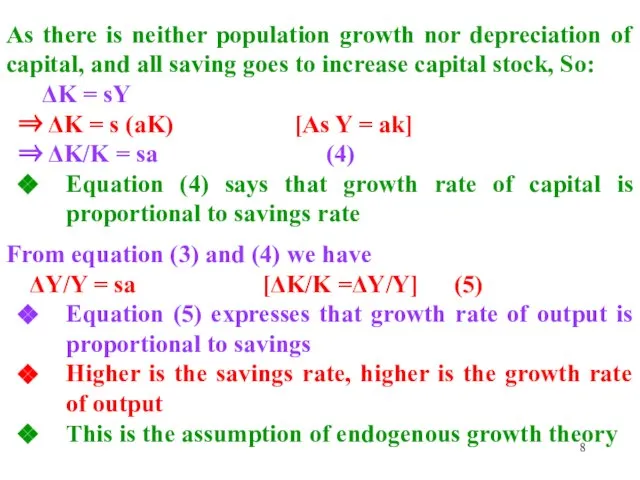
- 8. As there is neither population growth nor depreciation of capital, and all saving goes to increase
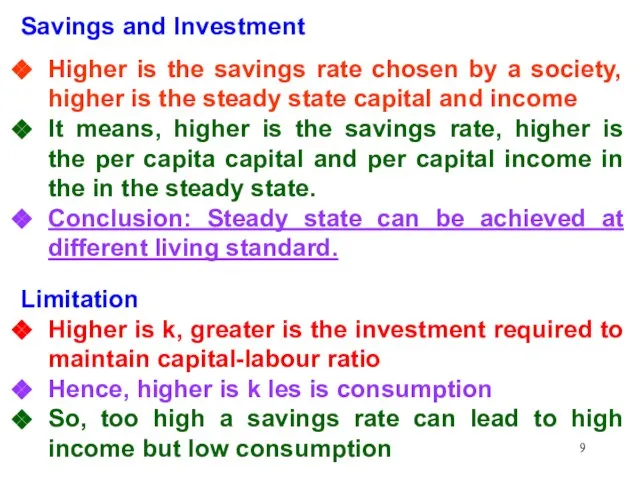
- 9. Savings and Investment Higher is the savings rate chosen by a society, higher is the steady
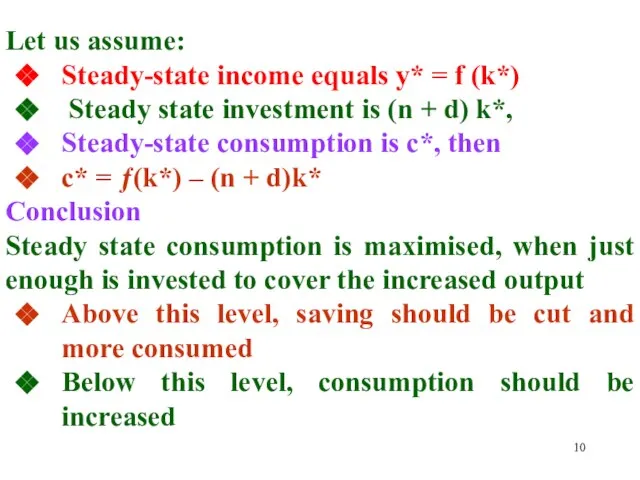
- 10. Let us assume: Steady-state income equals y* = f (k*) Steady state investment is (n +
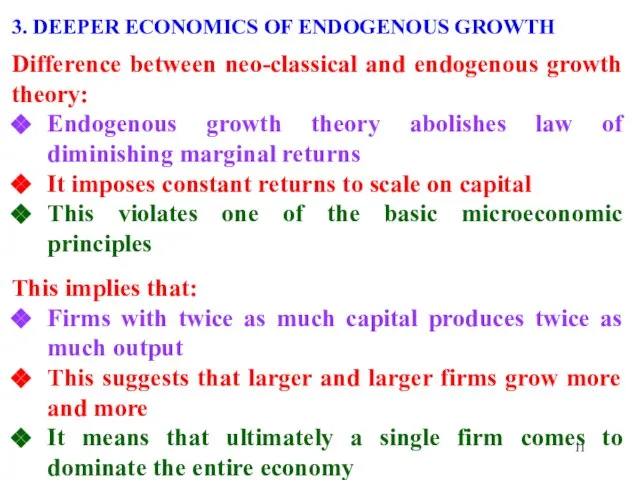
- 11. 3. DEEPER ECONOMICS OF ENDOGENOUS GROWTH Difference between neo-classical and endogenous growth theory: Endogenous growth theory
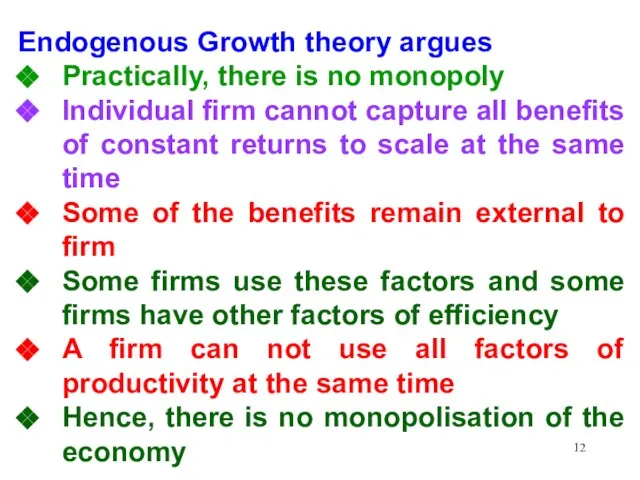
- 12. Endogenous Growth theory argues Practically, there is no monopoly Individual firm cannot capture all benefits of
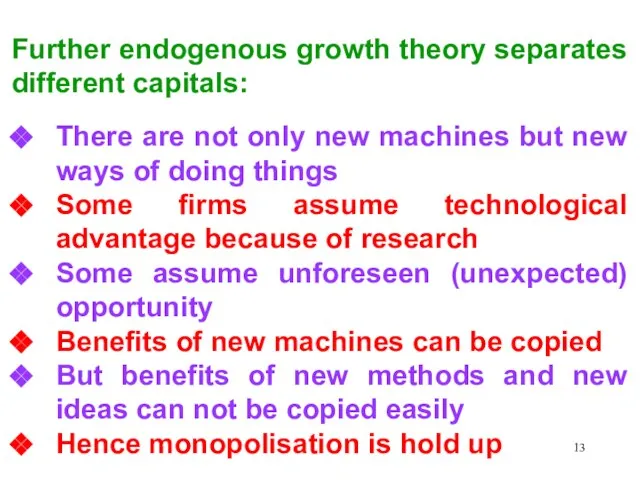
- 13. Further endogenous growth theory separates different capitals: There are not only new machines but new ways
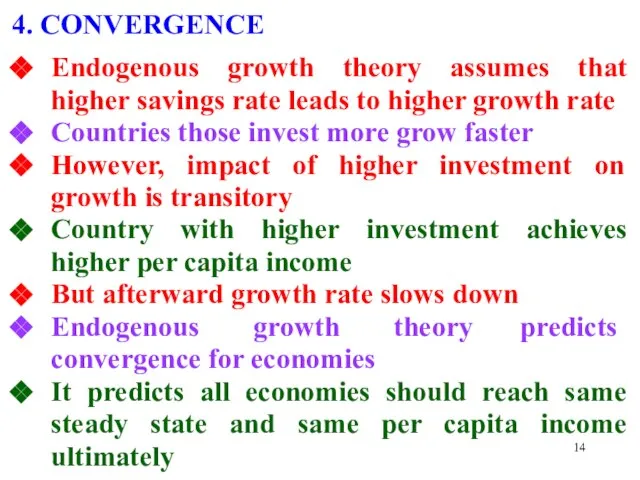
- 14. 4. CONVERGENCE Endogenous growth theory assumes that higher savings rate leads to higher growth rate Countries
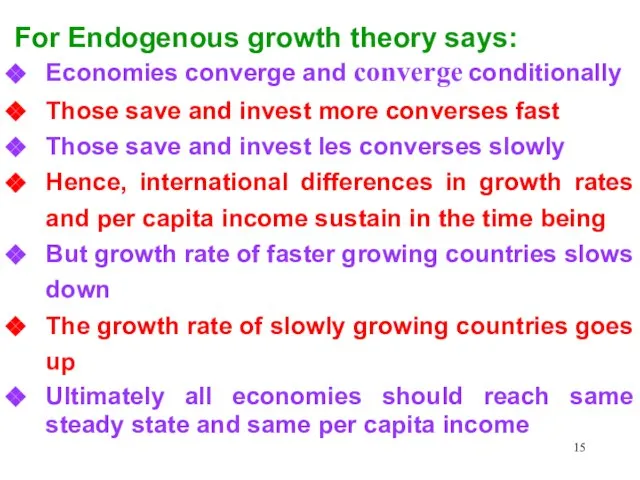
- 15. For Endogenous growth theory says: Economies converge and converge conditionally Those save and invest more converses
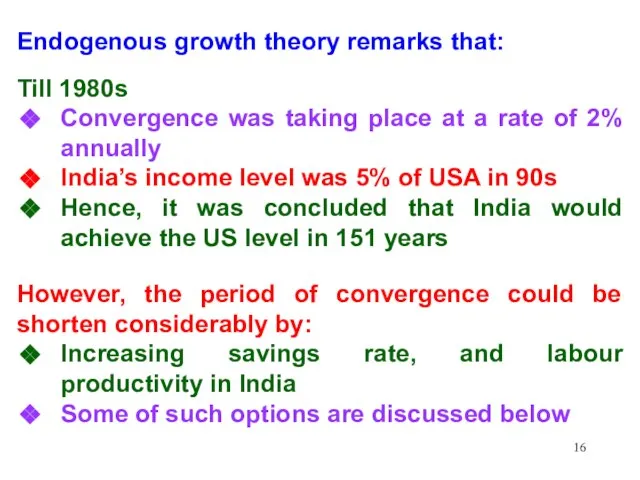
- 16. Endogenous growth theory remarks that: Till 1980s Convergence was taking place at a rate of 2%
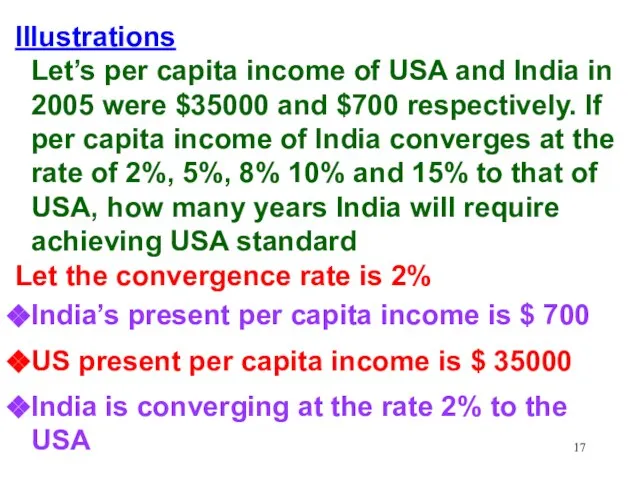
- 17. Illustrations Let’s per capita income of USA and India in 2005 were $35000 and $700 respectively.
- 18. We know that: Future Income = Present Income (1+r)n Where n is the years and r
- 19. Let the convergence rate is 5% We know that: Future Income = Present Income (1+r)n Where
- 20. Let the convergence rate is 8% We know that: Future Income = Present Income (1+r)n Where
- 21. Let the convergence rate is 10% We know that: Future Income = Present Income (1+r)n Where
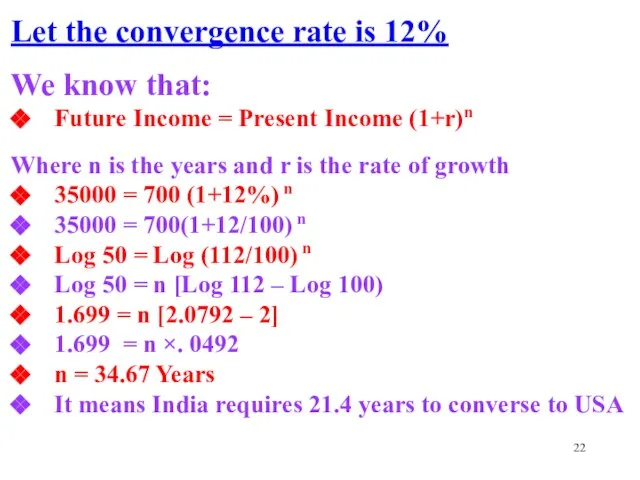
- 22. Let the convergence rate is 12% We know that: Future Income = Present Income (1+r)n Where
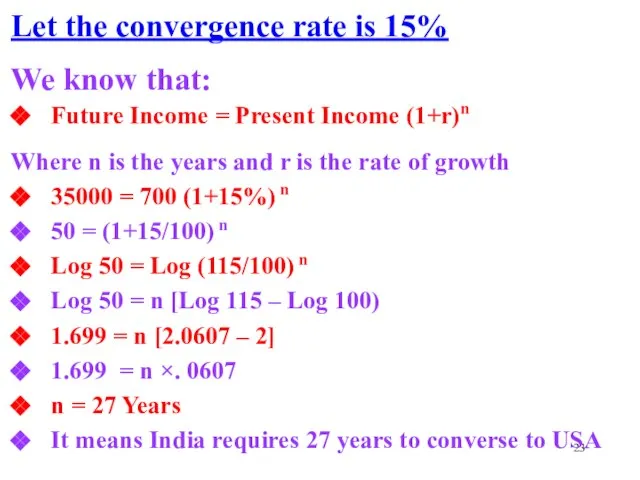
- 23. Let the convergence rate is 15% We know that: Future Income = Present Income (1+r)n Where
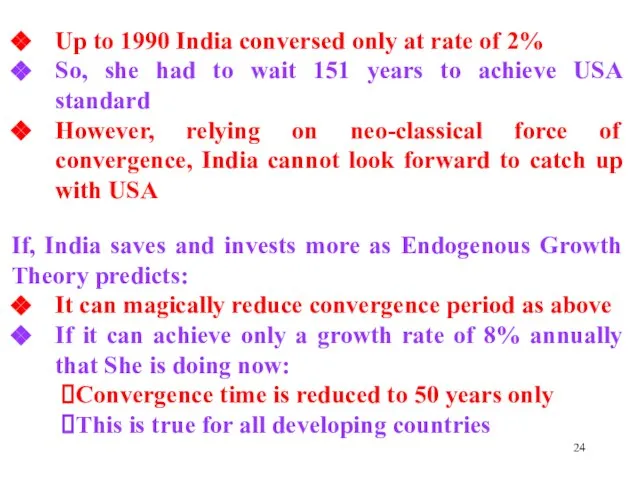
- 24. Up to 1990 India conversed only at rate of 2% So, she had to wait 151
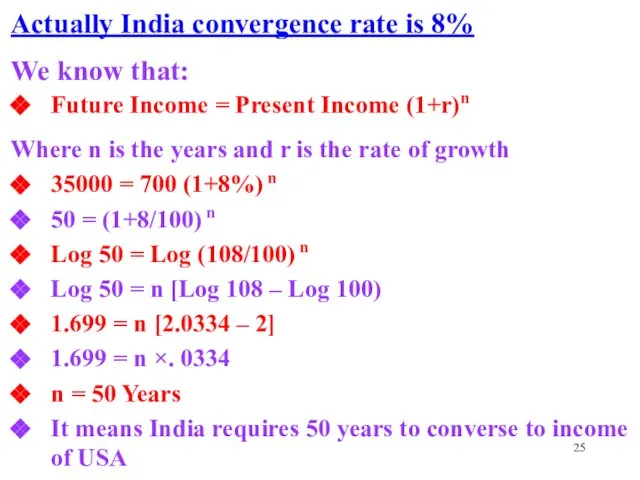
- 25. Actually India convergence rate is 8% We know that: Future Income = Present Income (1+r)n Where
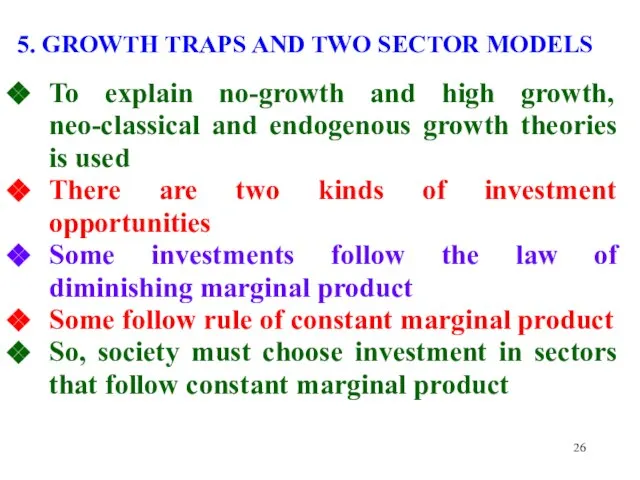
- 26. 5. GROWTH TRAPS AND TWO SECTOR MODELS To explain no-growth and high growth, neo-classical and endogenous
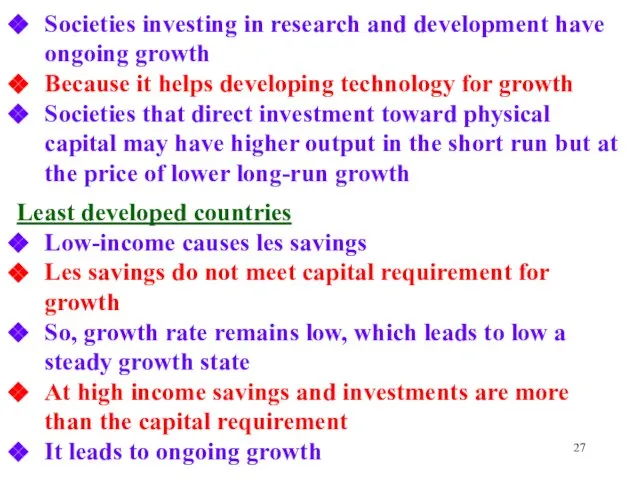
- 27. Societies investing in research and development have ongoing growth Because it helps developing technology for growth
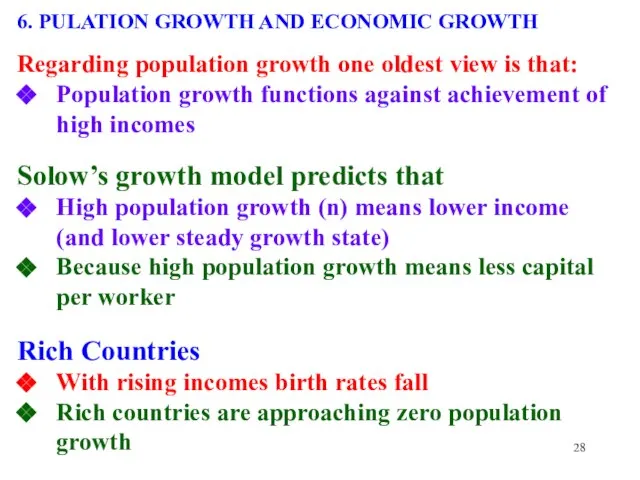
- 28. 6. PULATION GROWTH AND ECONOMIC GROWTH Regarding population growth one oldest view is that: Population growth
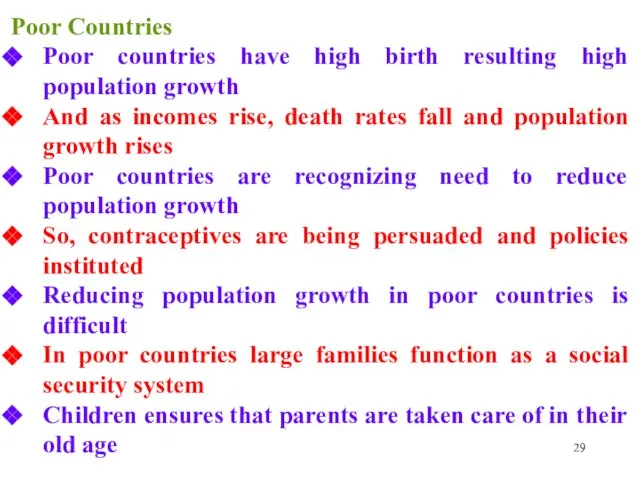
- 29. Poor Countries Poor countries have high birth resulting high population growth And as incomes rise, death
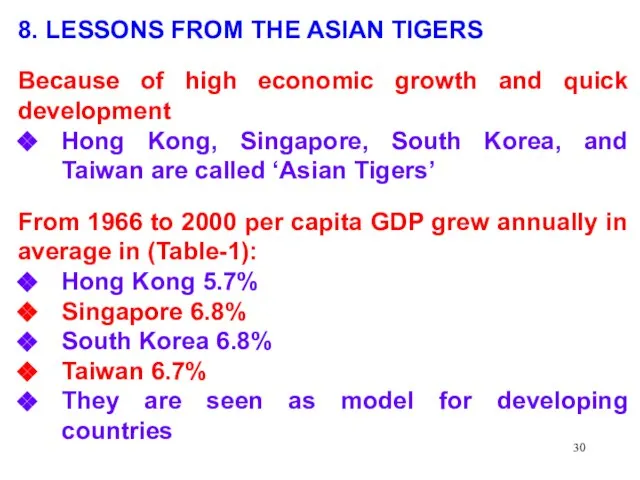
- 30. 8. LESSONS FROM THE ASIAN TIGERS Because of high economic growth and quick development Hong Kong,
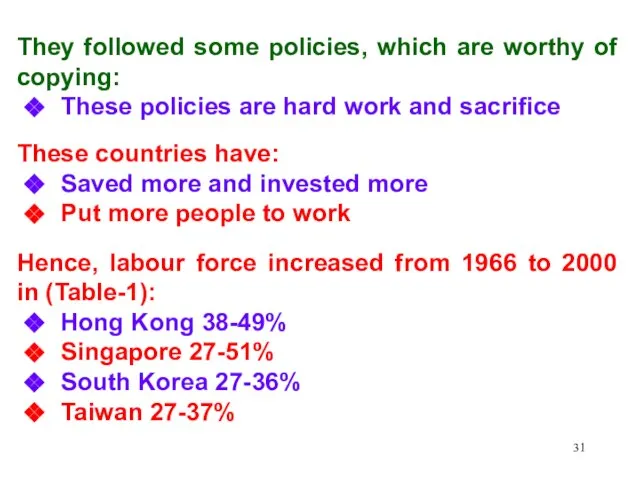
- 31. They followed some policies, which are worthy of copying: These policies are hard work and sacrifice
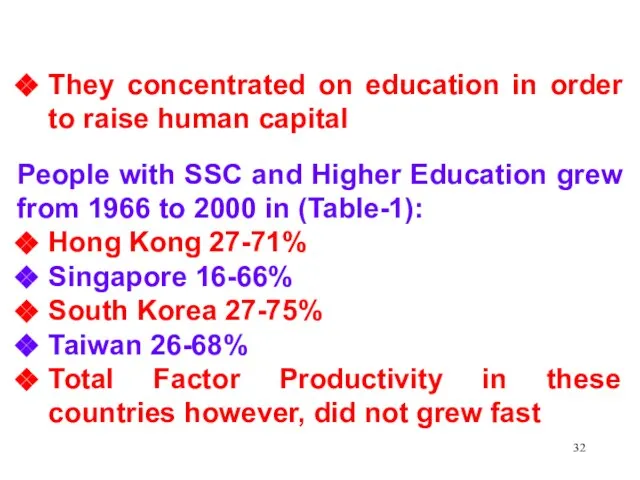
- 32. They concentrated on education in order to raise human capital People with SSC and Higher Education
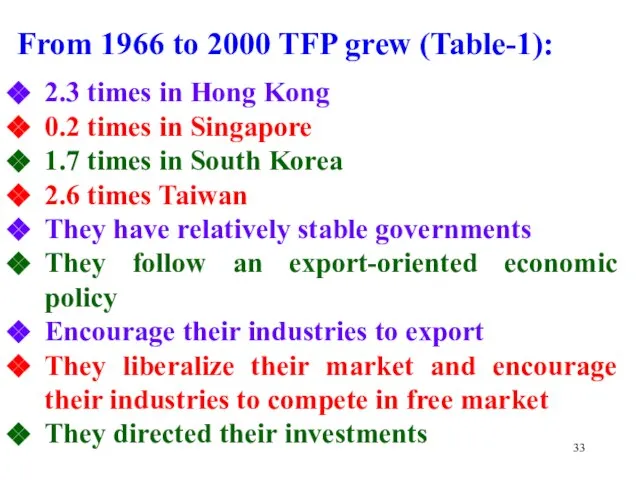
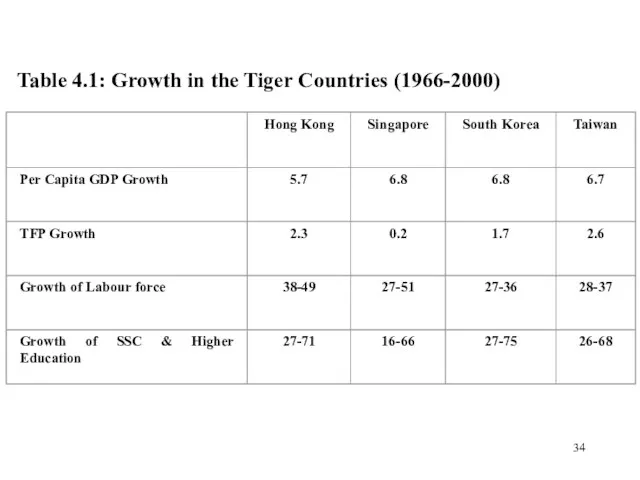
- 33. From 1966 to 2000 TFP grew (Table-1): 2.3 times in Hong Kong 0.2 times in Singapore
- 34. Table 4.1: Growth in the Tiger Countries (1966-2000)
- 35. They have encouraged foreign investment to bring in new technologies The Tigers Countries have achieved something
- 36. 9. THE GROWTH OF POOR COUNTRIES Growth of Bangladesh illustrates a striking problem Till 1990 it
- 37. What to do Population growth in poor countries was much higher than in Japan & USA-
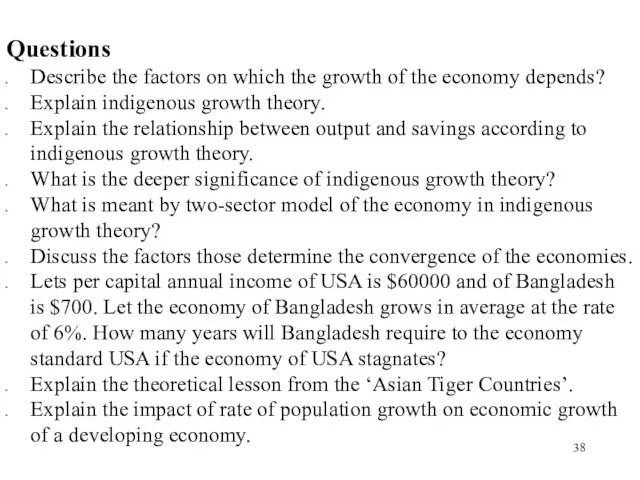
- 38. Questions Describe the factors on which the growth of the economy depends? Explain indigenous growth theory.
- 40. Скачать презентацию
Слайд 31. THE ENDOGENOUS GROWTH
Background
Neo-classical growth theory dominated economic thought from 1950 to
1. THE ENDOGENOUS GROWTH
Background
Neo-classical growth theory dominated economic thought from 1950 to
Слайд 4According to Neo-classical theory:
Steady-state is achieved at a point where savings and
According to Neo-classical theory:
Steady-state is achieved at a point where savings and
Слайд 5Endogenous growth theory (Figure -1)
Modifies the shape of the production function
It denies
Endogenous growth theory (Figure -1)
Modifies the shape of the production function
It denies
Слайд 6Figure -1: Production and saving function in endogenous growth theory
Y Output per
Figure -1: Production and saving function in endogenous growth theory
Y Output per
Слайд 7Endogenous growth theory presumes capital as the only factor for growth, so:
Endogenous growth theory presumes capital as the only factor for growth, so:
Слайд 8As there is neither population growth nor depreciation of capital, and all
As there is neither population growth nor depreciation of capital, and all
Слайд 9Savings and Investment
Higher is the savings rate chosen by a society, higher
Savings and Investment
Higher is the savings rate chosen by a society, higher
Слайд 10Let us assume:
Steady-state income equals y* = f (k*)
Steady state
Let us assume:
Steady-state income equals y* = f (k*)
Steady state
Слайд 113. DEEPER ECONOMICS OF ENDOGENOUS GROWTH
Difference between neo-classical and endogenous growth theory:
Endogenous
3. DEEPER ECONOMICS OF ENDOGENOUS GROWTH
Difference between neo-classical and endogenous growth theory:
Endogenous
Слайд 12Endogenous Growth theory argues
Practically, there is no monopoly
Individual firm cannot capture all
Endogenous Growth theory argues
Practically, there is no monopoly
Individual firm cannot capture all
Слайд 13Further endogenous growth theory separates different capitals:
There are not only new machines
Further endogenous growth theory separates different capitals:
There are not only new machines
Слайд 144. CONVERGENCE
Endogenous growth theory assumes that higher savings rate leads to higher
4. CONVERGENCE
Endogenous growth theory assumes that higher savings rate leads to higher
Слайд 15For Endogenous growth theory says:
Economies converge and converge conditionally
Those save and
For Endogenous growth theory says:
Economies converge and converge conditionally
Those save and
Слайд 16Endogenous growth theory remarks that:
Till 1980s
Convergence was taking place at a
Endogenous growth theory remarks that:
Till 1980s
Convergence was taking place at a
Слайд 17Illustrations
Let’s per capita income of USA and India in 2005 were $35000
Illustrations
Let’s per capita income of USA and India in 2005 were $35000
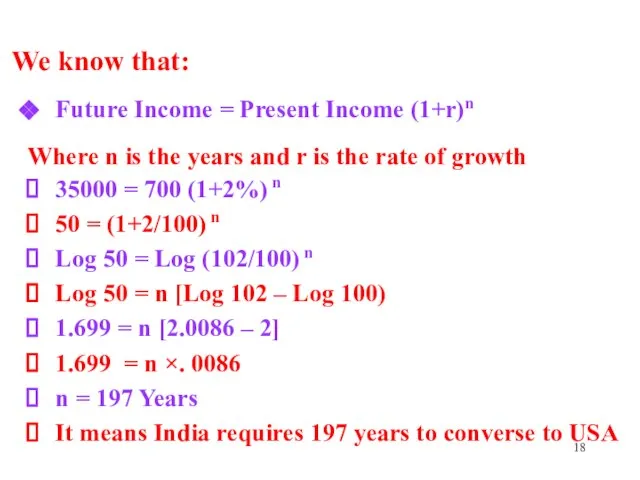
Слайд 18We know that:
Future Income = Present Income (1+r)n
Where n is the years
We know that:
Future Income = Present Income (1+r)n
Where n is the years
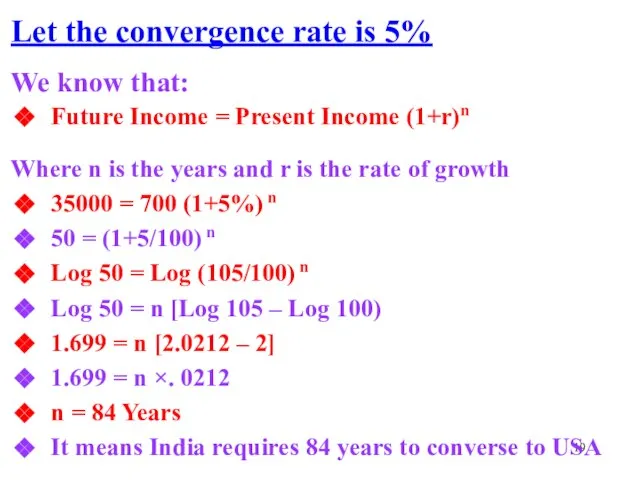
Слайд 19Let the convergence rate is 5%
We know that:
Future Income = Present Income
Let the convergence rate is 5%
We know that:
Future Income = Present Income
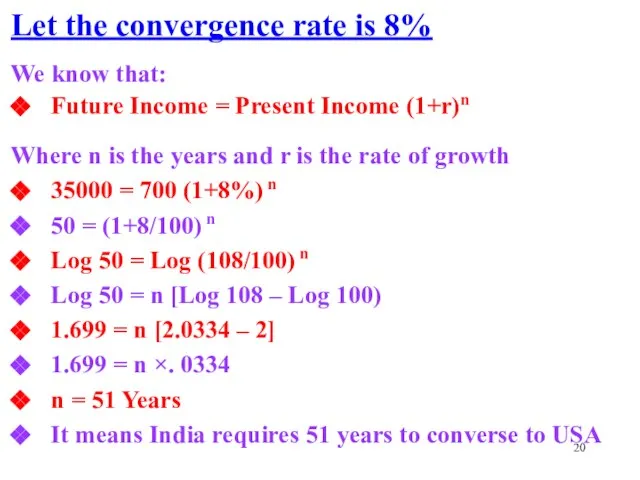
Слайд 20Let the convergence rate is 8%
We know that:
Future Income = Present Income
Let the convergence rate is 8%
We know that:
Future Income = Present Income
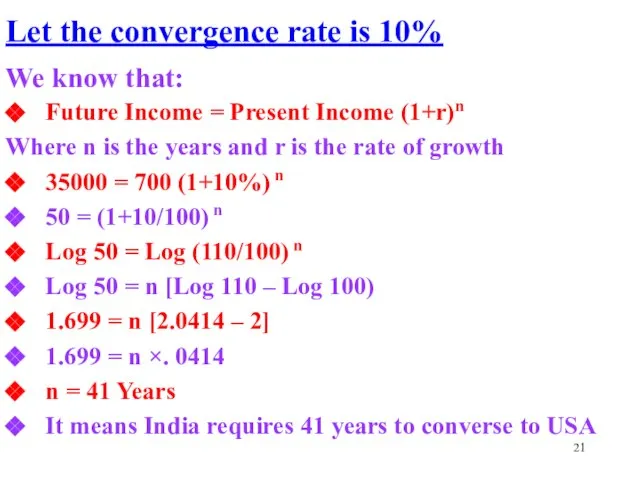
Слайд 21Let the convergence rate is 10%
We know that:
Future Income = Present Income
Let the convergence rate is 10%
We know that:
Future Income = Present Income
Слайд 22Let the convergence rate is 12%
We know that:
Future Income = Present Income
Let the convergence rate is 12%
We know that:
Future Income = Present Income
Слайд 23Let the convergence rate is 15%
We know that:
Future Income = Present Income
Let the convergence rate is 15%
We know that:
Future Income = Present Income
Слайд 24Up to 1990 India conversed only at rate of 2%
So, she had
Up to 1990 India conversed only at rate of 2%
So, she had
Слайд 25Actually India convergence rate is 8%
We know that:
Future Income = Present Income
Actually India convergence rate is 8%
We know that:
Future Income = Present Income
Слайд 265. GROWTH TRAPS AND TWO SECTOR MODELS
To explain no-growth and high growth,
5. GROWTH TRAPS AND TWO SECTOR MODELS
To explain no-growth and high growth,
Слайд 27Societies investing in research and development have ongoing growth
Because it helps developing
Societies investing in research and development have ongoing growth
Because it helps developing
Слайд 286. PULATION GROWTH AND ECONOMIC GROWTH
Regarding population growth one oldest view
6. PULATION GROWTH AND ECONOMIC GROWTH
Regarding population growth one oldest view
Слайд 29Poor Countries
Poor countries have high birth resulting high population growth
And as incomes
Poor Countries
Poor countries have high birth resulting high population growth
And as incomes
Слайд 308. LESSONS FROM THE ASIAN TIGERS
Because of high economic growth and quick
8. LESSONS FROM THE ASIAN TIGERS
Because of high economic growth and quick
Слайд 31They followed some policies, which are worthy of copying:
These policies are hard
They followed some policies, which are worthy of copying:
These policies are hard
Слайд 32They concentrated on education in order to raise human capital
People with SSC
They concentrated on education in order to raise human capital
People with SSC
Слайд 33From 1966 to 2000 TFP grew (Table-1):
2.3 times in Hong Kong
0.2
From 1966 to 2000 TFP grew (Table-1):
2.3 times in Hong Kong
0.2
Слайд 34Table 4.1: Growth in the Tiger Countries (1966-2000)
Table 4.1: Growth in the Tiger Countries (1966-2000)
Слайд 35They have encouraged foreign investment to bring in new technologies
The Tigers Countries
They have encouraged foreign investment to bring in new technologies
The Tigers Countries
Слайд 369. THE GROWTH OF POOR COUNTRIES
Growth of Bangladesh illustrates a striking problem
Till
9. THE GROWTH OF POOR COUNTRIES
Growth of Bangladesh illustrates a striking problem
Till
Слайд 37What to do
Population growth in poor countries was much higher than in
What to do
Population growth in poor countries was much higher than in
Слайд 38Questions
Describe the factors on which the growth of the economy depends?
Explain indigenous
Questions
Describe the factors on which the growth of the economy depends?
Explain indigenous
 Понятие автономного образовательного учреждения и его отличия от государственного и муниципального образовательного учреждени
 КОЛЫБЕЛИ НАДЕЖДЫ:право на жизнь для новорожденных в Украине
 Работа психолога в спорте-1
 Логистика как инструмент снижения издержек
  СО стороны ФОМС
 Классицизм в архитектуре Ульяновска
 Political Science — A political order
  «Феномен женщины на войне в общественном сознании» (исследовательский реферат)направление : социология
 Проект «Моя заветная мечта»
 ПТИЦЫ
ПТИЦЫ Лексика Антонимы Фразеологические обороты
 Грамматическое значение причастий
 Чтобы не было пожара
 Город оригами - Великий Устюг. Кадетский класс
 Элементы логики в пропедевтическом курсе информатики и ИКТ
 Выразительно-графические свойства композиции (точка, линия, пятно)
 Защита от иска правообладателя товарного знака
 Романтизм в живописи
 Создание фотоальбома в программе Windows Movie Maker
 Статистические методы в изучении предпринимательства
 Общая психология. Воображение
 Основы сетевого администрирования
  представляет 4 Уникальная система для хирургии переднего и заднего отделов глаза Megatron® S4 Благодаря множеству применяемых инновац
 «Мы -за правильное питание» МБОУ «Гмелинская СОШ» 4 «А»класс
 Роль отца в формировании личности ребенка
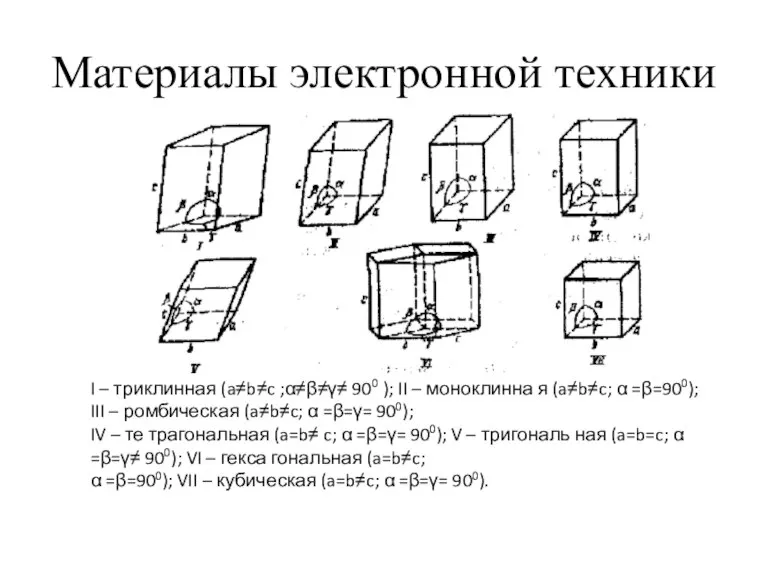 Материалы электронной техники
 БиоАгроТех. Предложение по сушке и сжиганию клеточного помета с выработкой тепла на ГВС и отопление
 Проект выполнили ученицы 11 А класса СОШ №3 Смирнова Вера и Алексеева Оксана