- histograms

Содержание
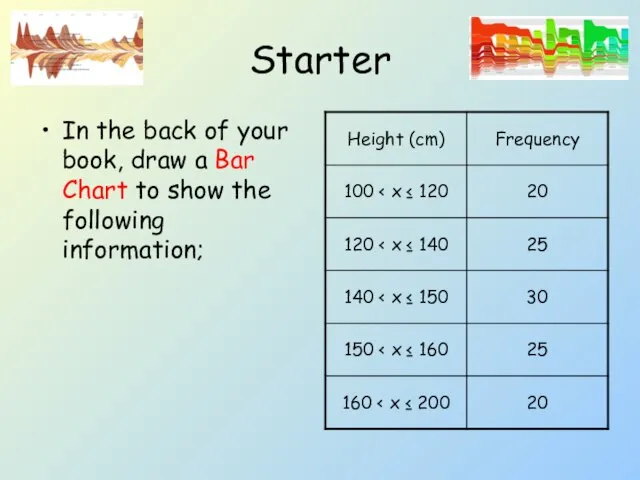
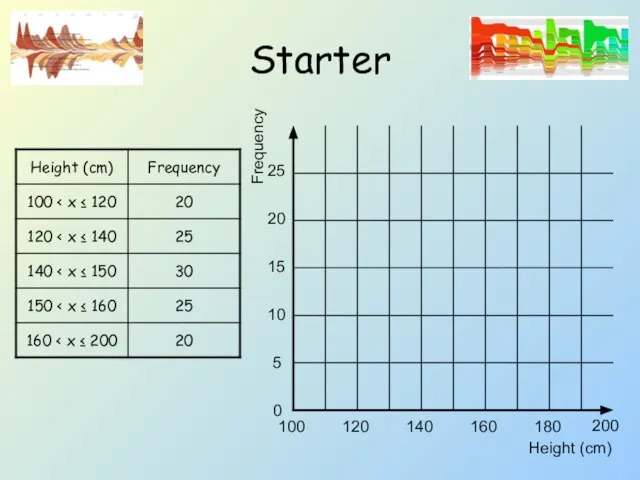
- 2. Starter In the back of your book, draw a Bar Chart to show the following information;
- 3. Starter Height (cm) Frequency 0 5 20 15 10 100 25 120 180 160 140 200
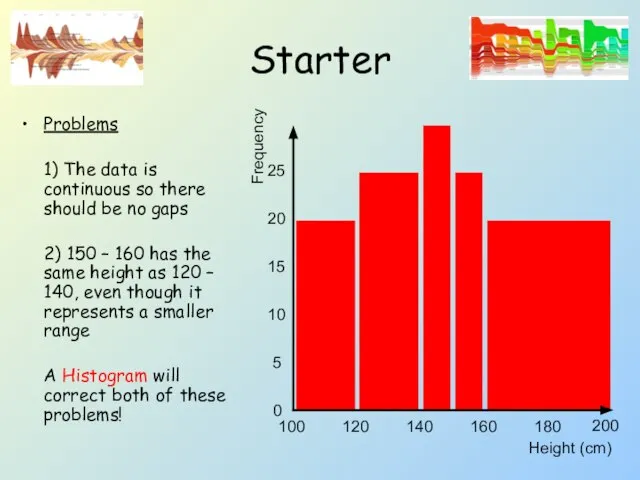
- 4. Starter Problems 1) The data is continuous so there should be no gaps 2) 150 –
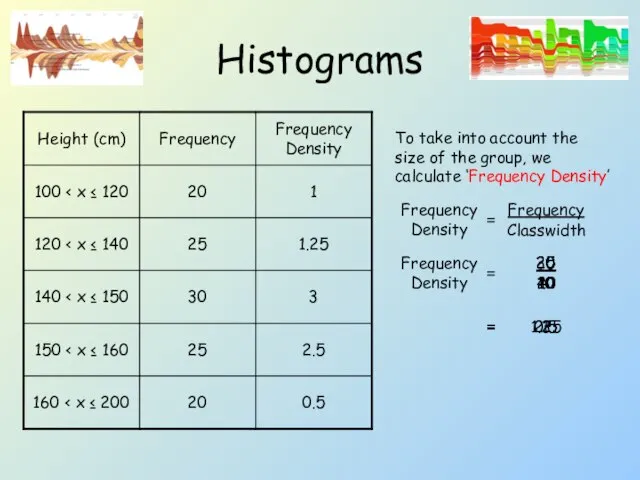
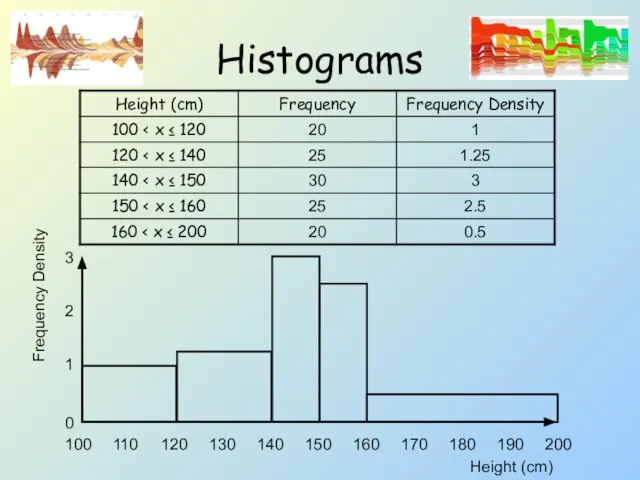
- 5. Histograms 20 25 30 25 20 Frequency 0.5 160 2.5 150 3 140 1.25 120 1
- 6. Histograms 100 140 130 120 150 160 180 170 110 200 190 1 2 3 0
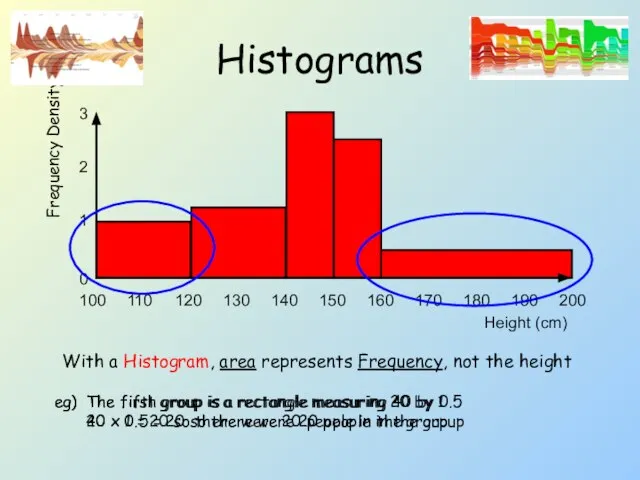
- 7. Histograms With a Histogram, area represents Frequency, not the height eg) The first group is a
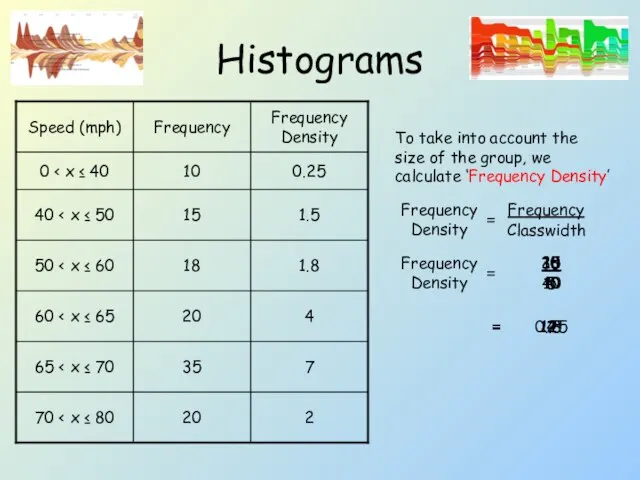
- 8. Histograms To take into account the size of the group, we calculate ‘Frequency Density’ Frequency Density
- 9. Histograms 0 80 40 30 20 10 60 50 70 10 2 8 6 4 0
- 10. Histograms 0 80 40 30 20 10 60 50 70 10 2 8 6 4 0
- 11. Plenary (4) 33g 103g Frequency Density 0.5 2.2 5.3 0.5
- 12. Plenary 1 Frequency Density 6 5 4 3 2 Egg Weight (g)
- 14. Скачать презентацию
Слайд 3Starter
Height (cm)
Frequency
0
5
20
15
10
100
25
120
180
160
140
200
Starter
Height (cm)
Frequency
0
5
20
15
10
100
25
120
180
160
140
200
Слайд 4Starter
Problems
1) The data is continuous so there should be no gaps
2) 150
Starter
Problems
1) The data is continuous so there should be no gaps
2) 150
Слайд 5Histograms
20
25
30
25
20
Frequency
0.5
160 < x ≤ 200
2.5
150 < x ≤ 160
3
140 < x ≤
Histograms
20
25
30
25
20
Frequency
0.5
160 < x ≤ 200
2.5
150 < x ≤ 160
3
140 < x ≤
Слайд 6Histograms
100
140
130
120
150
160
180
170
110
200
190
1
2
3
0
Frequency Density
Height (cm)
Histograms
100
140
130
120
150
160
180
170
110
200
190
1
2
3
0
Frequency Density
Height (cm)
Слайд 7Histograms
With a Histogram, area represents Frequency, not the height
eg) The first group is
Histograms
With a Histogram, area represents Frequency, not the height
eg) The first group is
Слайд 8Histograms
To take into account the size of the group, we calculate ‘Frequency
Histograms
To take into account the size of the group, we calculate ‘Frequency
Слайд 9Histograms
0
80
40
30
20
10
60
50
70
10
2
8
6
4
0
Frequency Density
Speed (mph)
Histograms
0
80
40
30
20
10
60
50
70
10
2
8
6
4
0
Frequency Density
Speed (mph)
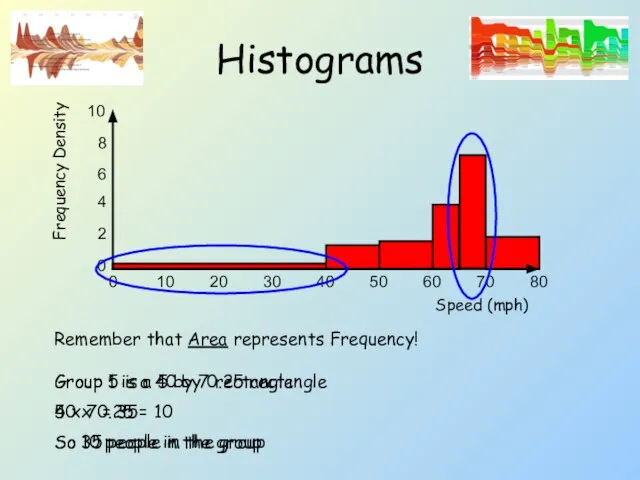
Слайд 10Histograms
0
80
40
30
20
10
60
50
70
10
2
8
6
4
0
Frequency Density
Speed (mph)
Group 1 is a 40 by 0.25 rectangle
40 x 0.25
Histograms
0
80
40
30
20
10
60
50
70
10
2
8
6
4
0
Frequency Density
Speed (mph)
Group 1 is a 40 by 0.25 rectangle
40 x 0.25
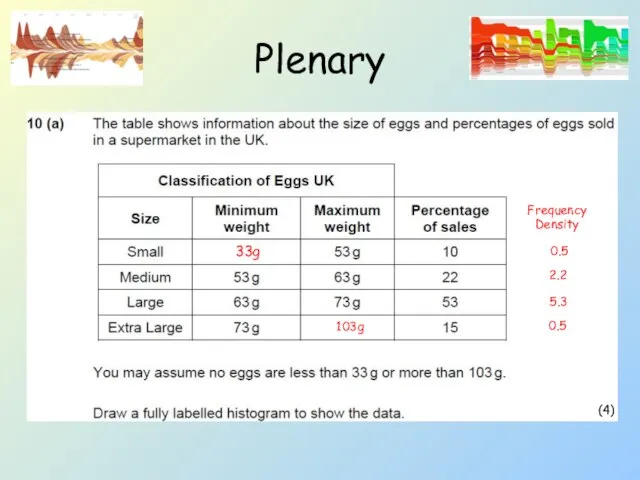
Слайд 11Plenary
(4)
33g
103g
Frequency Density
0.5
2.2
5.3
0.5
Plenary
(4)
33g
103g
Frequency Density
0.5
2.2
5.3
0.5
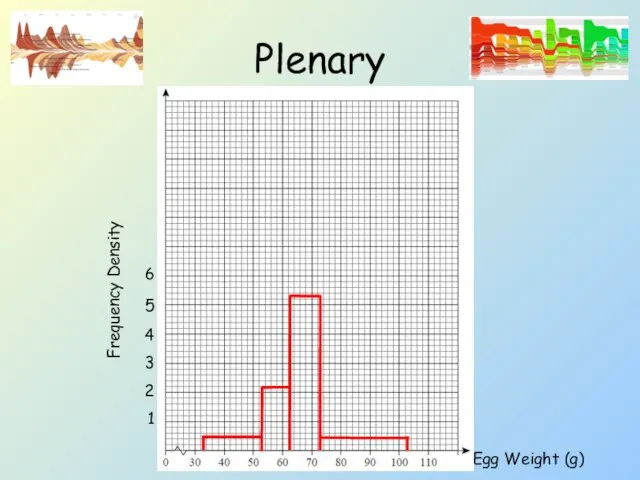
Слайд 12Plenary
1
Frequency Density
6
5
4
3
2
Egg Weight (g)
Plenary
1
Frequency Density
6
5
4
3
2
Egg Weight (g)
 Презентация на тему Трансформатор. Передача электрической энергии на расстояние
  Тула - Родина моя
 9м 27.10
 Зачетная работа. Организационная структура отеля Крокус
 Звірі (ссавці)
 9 класс. Выполнение задания С2.1 Сочинение-рассуждение на лингвистическую тему
 01_zemlepolzovanie
 Регионы Сибирского федерального округав инвестиционных рейтингах:риски, препятствия и потенциал инвестирования Дмит
 LUNG Diseases
 Упрощение выражений в самостоятельной работе
 Символика МОУ Караяшниковская СОШ
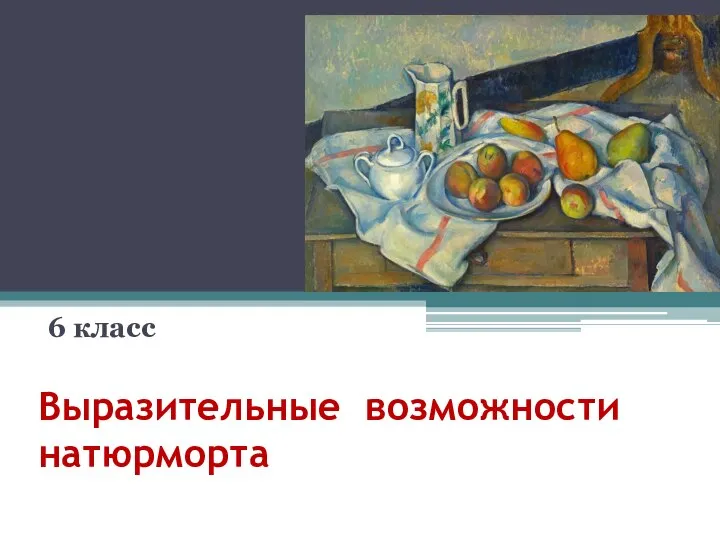 Выразительные возможности натюрморта
 Психологические парадоксы в экономике
 4cde4c0ca65b9adc
 СИСТЕМЫ ВИДЕОНАБЛЮДЕНИЯ В ОБЩЕСТВЕННЫХ МЕСТАХ
 Захарова Ольга Леонидовна- "Твори добро на радость людям!" МОУ "Зоркальцевская СОШ"
 Яркое осеннее шоу Три кота. Праздничное агенство, работающие в школьных и дошкольных заведениях
 Органы и системы органов животных 6 класс
 Тематический ресторан
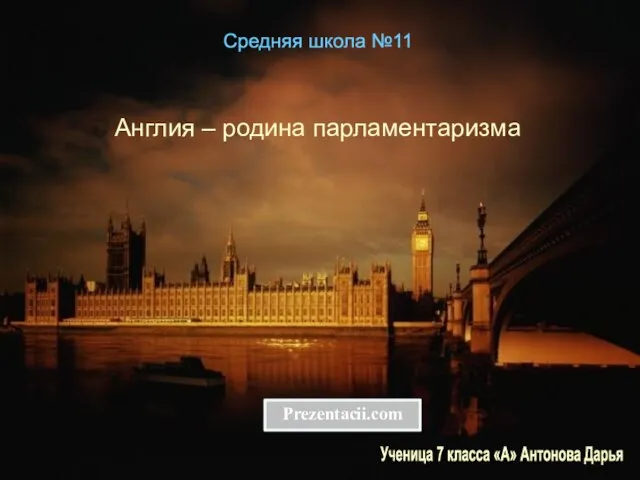 Презентация на тему Англия – родина парламентаризма
  Приматы
 Зимние святки у славян. Таинство гадания
 Актуальные вопросы поддержки детей и семей, находящихся в трудной жизненной ситуации Руководитель департамента стратегического
  Тест "Античные Олимпийские игры"
 Презентация на тему: Правила полива комнатных растений
 ВсероссийскийИнтернет-МАРАФОН '2006
 Sights of New York
 Искусство презентации как средство продвижения своей компании и ее продуктов