- Probability Theory

Содержание
- 2. 11-Aug-23 Lecture 9 Uniform Distribution. Normal (Gaussian Distribution) Distributions.
- 3. 11-Aug-23 Contents Uniform distribution – the general view The Normal Distribution
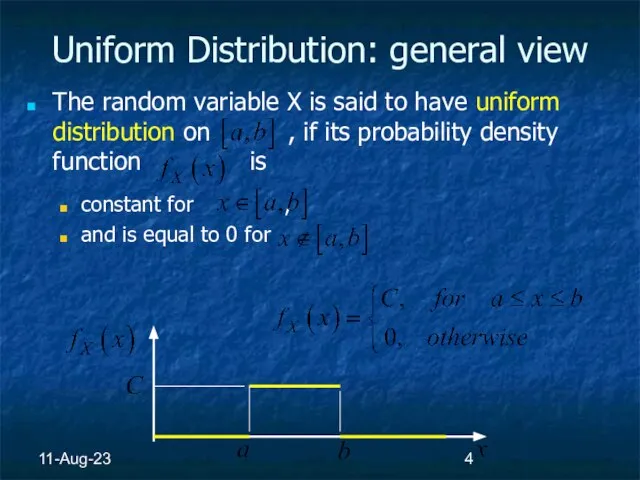
- 4. 11-Aug-23 Uniform Distribution: general view The random variable X is said to have uniform distribution on
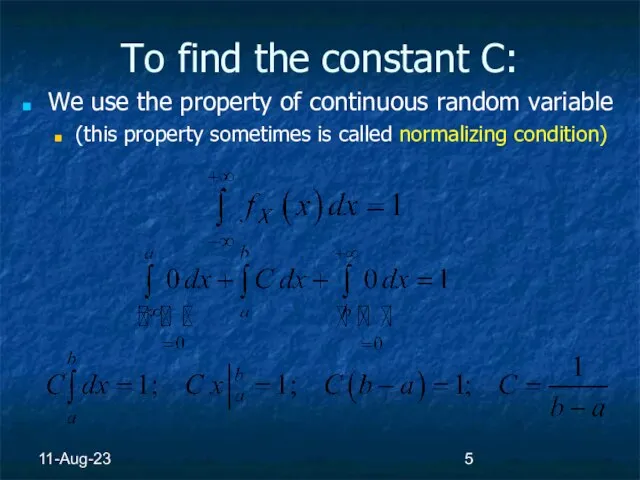
- 5. 11-Aug-23 To find the constant C: We use the property of continuous random variable (this property
- 6. 11-Aug-23 So we have in the general terms: For example, if we are interesting in probability
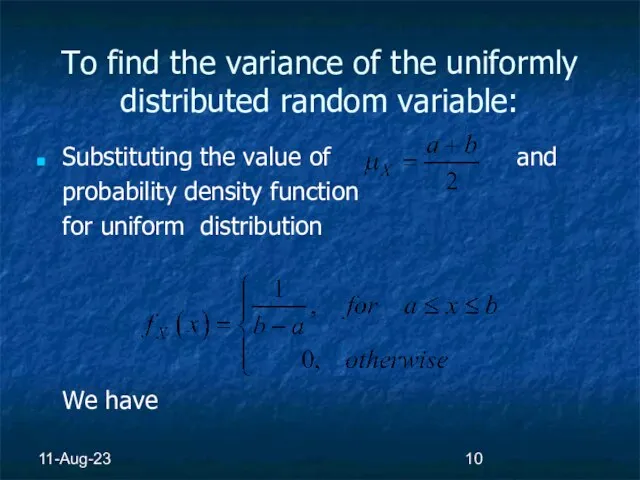
- 7. 11-Aug-23 To find the expectation of the uniformly distributed random variable: We remember the definition of
- 8. 11-Aug-23 To find the expectation of the uniformly distributed random variable: For the uniform distribution
- 9. 11-Aug-23 To find the variance of the uniformly distributed random variable: We remember the definition of
- 10. 11-Aug-23 To find the variance of the uniformly distributed random variable: Substituting the value of and
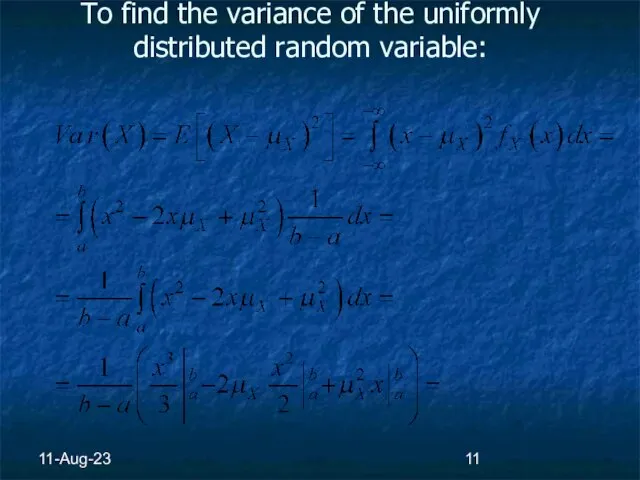
- 11. 11-Aug-23 To find the variance of the uniformly distributed random variable:
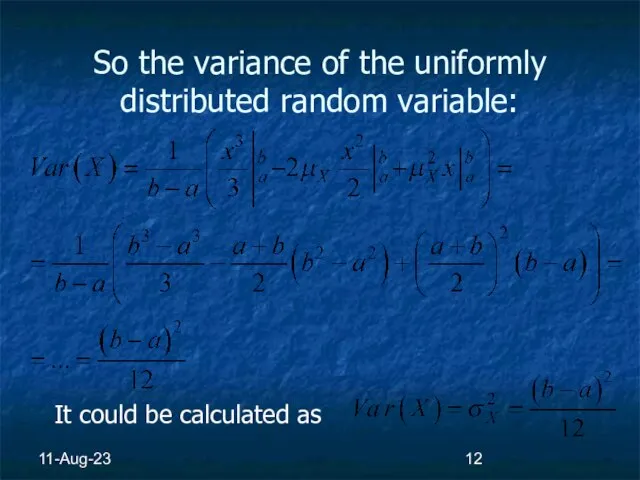
- 12. 11-Aug-23 So the variance of the uniformly distributed random variable: It could be calculated as
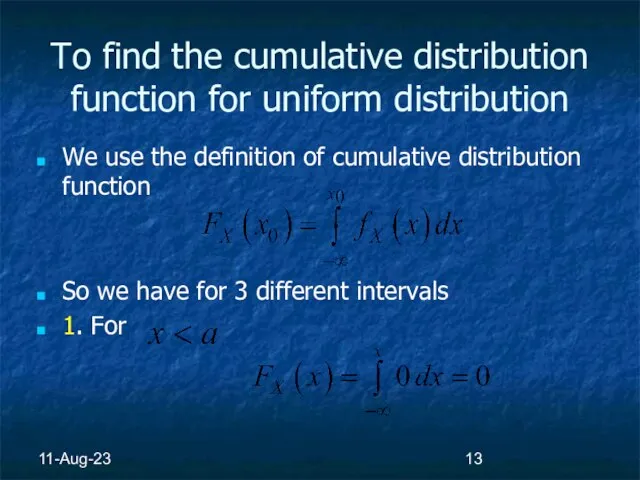
- 13. 11-Aug-23 To find the cumulative distribution function for uniform distribution We use the definition of cumulative
- 14. 11-Aug-23 To find the cumulative distribution function for uniform distribution 2. For 3. For
- 15. 11-Aug-23 Finally we obtain the cumulative distribution function for uniform distribution We have
- 16. 11-Aug-23 The Normal Distribution We introduce now a continuous distribution that plays a central role in
- 17. 11-Aug-23 The Normal Distribution If the average score on the test is 60, we would expect
- 18. 11-Aug-23 Probability Density Function of the Normal Distribution The shape of the probability density function is
- 19. 11-Aug-23 Probability Density Function of the Normal Distribution If the random variable X has probability density
- 20. 11-Aug-23 Comments It can be seen from the definition that there is not a single normal
- 21. 11-Aug-23 Some Properties of the Normal Distribution Suppose that the random variable X follows a normal
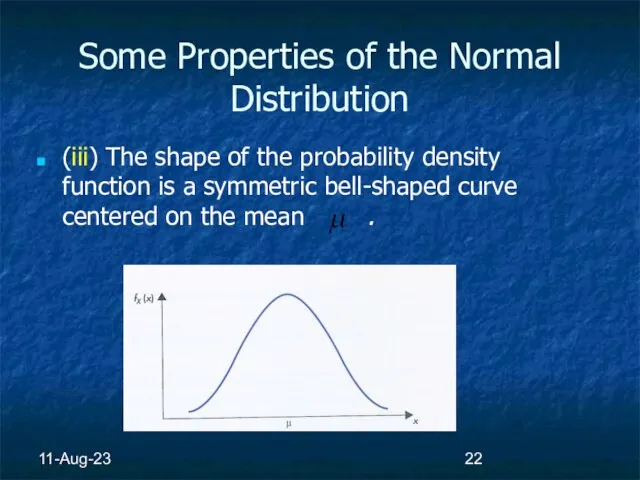
- 22. 11-Aug-23 Some Properties of the Normal Distribution (iii) The shape of the probability density function is
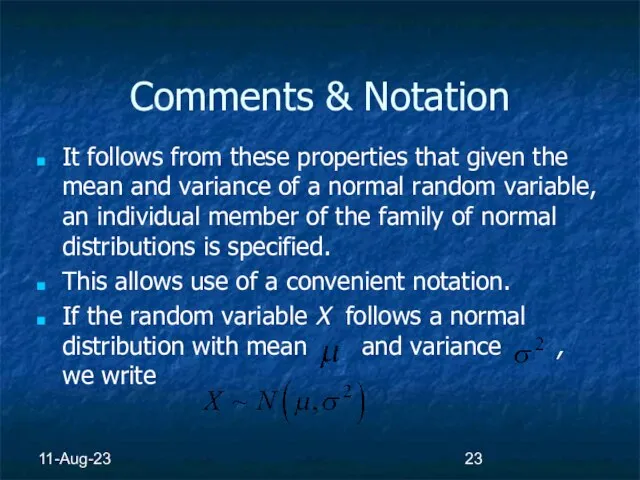
- 23. 11-Aug-23 Comments & Notation It follows from these properties that given the mean and variance of
- 24. 11-Aug-23 Comments Now, the mean of any distribution provides a measure of central location, while the
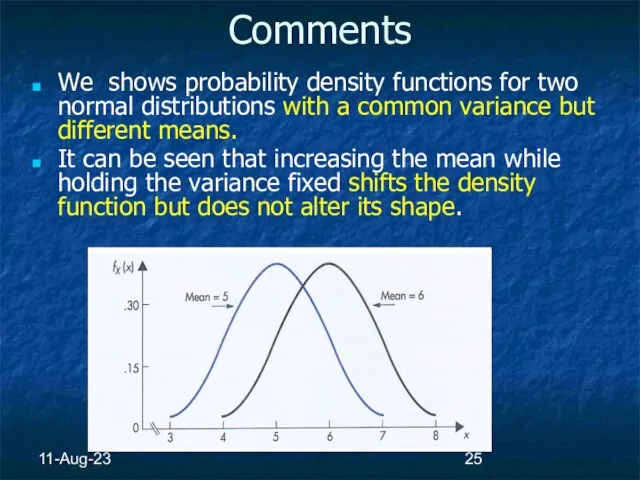
- 25. 11-Aug-23 Comments We shows probability density functions for two normal distributions with a common variance but
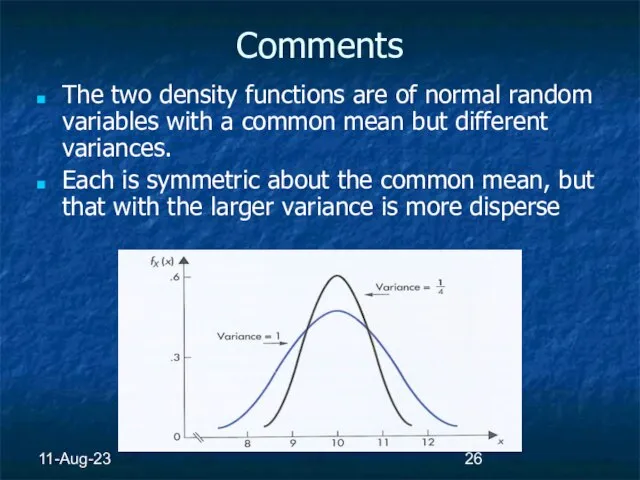
- 26. 11-Aug-23 Comments The two density functions are of normal random variables with a common mean but
- 27. 11-Aug-23 Cumulative Distribution Function of the Normal Distribution An extremely important practical question concerns the determination
- 28. 11-Aug-23 Cumulative Distribution Function of the Normal Distribution Suppose that X is a normal random variable
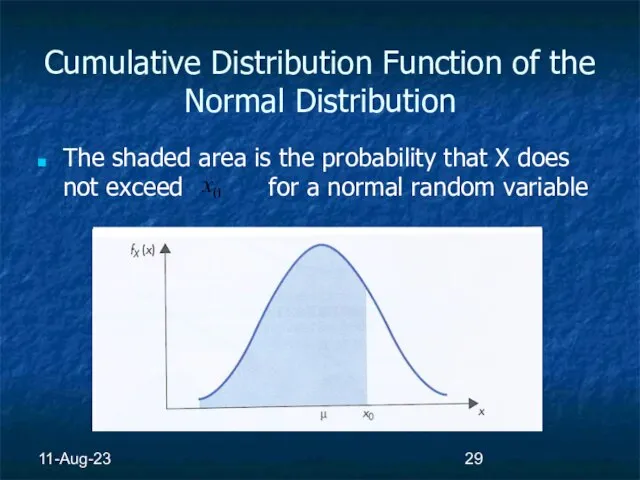
- 29. 11-Aug-23 Cumulative Distribution Function of the Normal Distribution The shaded area is the probability that X
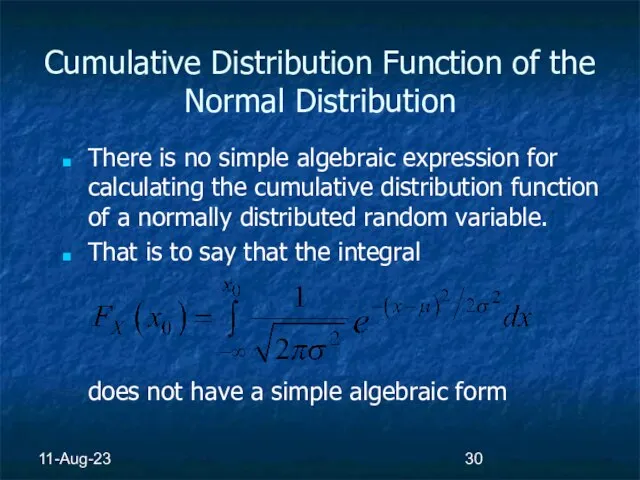
- 30. 11-Aug-23 Cumulative Distribution Function of the Normal Distribution There is no simple algebraic expression for calculating
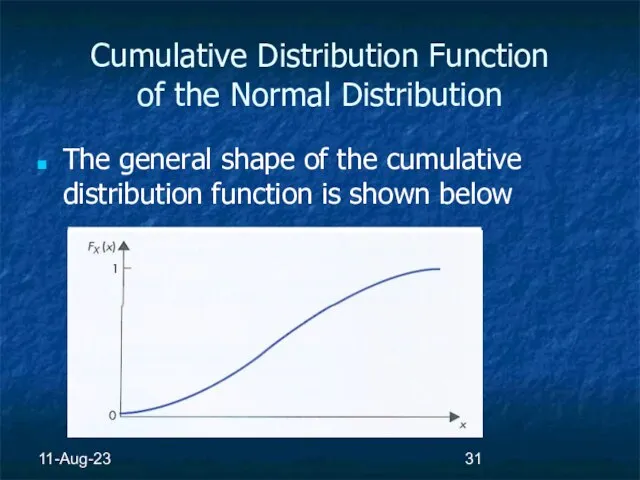
- 31. 11-Aug-23 Cumulative Distribution Function of the Normal Distribution The general shape of the cumulative distribution function
- 32. 11-Aug-23 Range Probabilities for Normal Random Variables We have already seen that for any continuous random
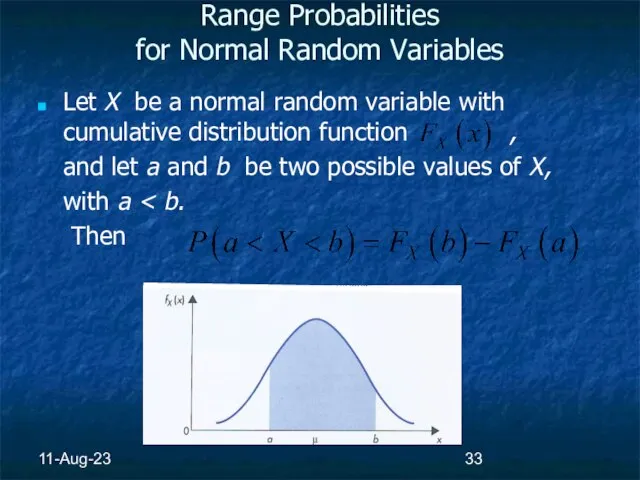
- 33. 11-Aug-23 Range Probabilities for Normal Random Variables Let X be a normal random variable with cumulative
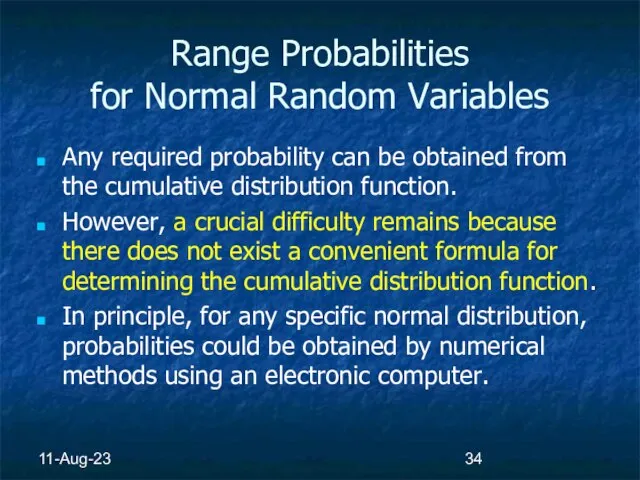
- 34. 11-Aug-23 Range Probabilities for Normal Random Variables Any required probability can be obtained from the cumulative
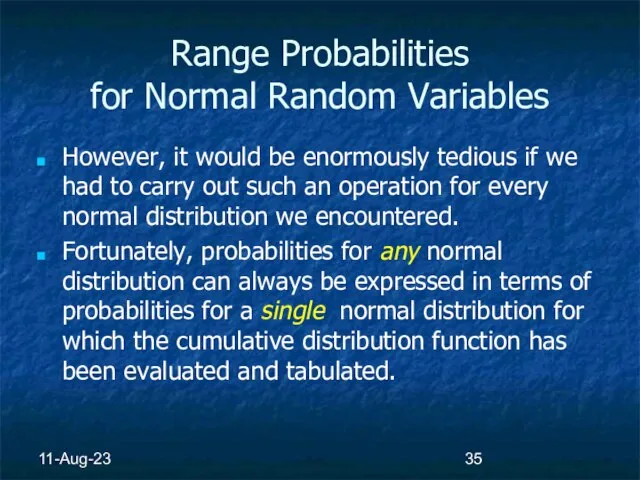
- 35. 11-Aug-23 Range Probabilities for Normal Random Variables However, it would be enormously tedious if we had
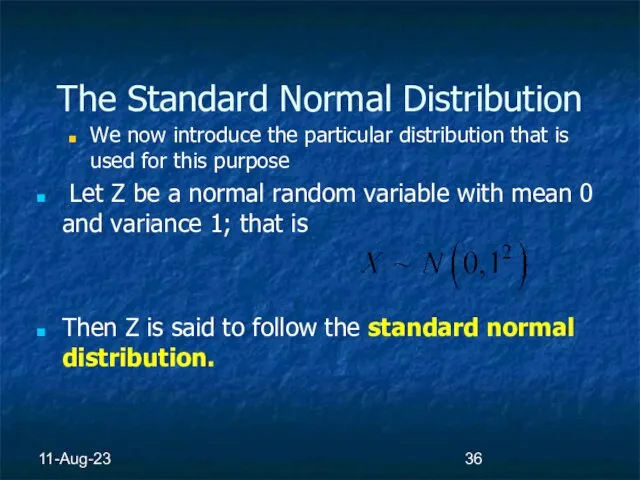
- 36. 11-Aug-23 The Standard Normal Distribution We now introduce the particular distribution that is used for this
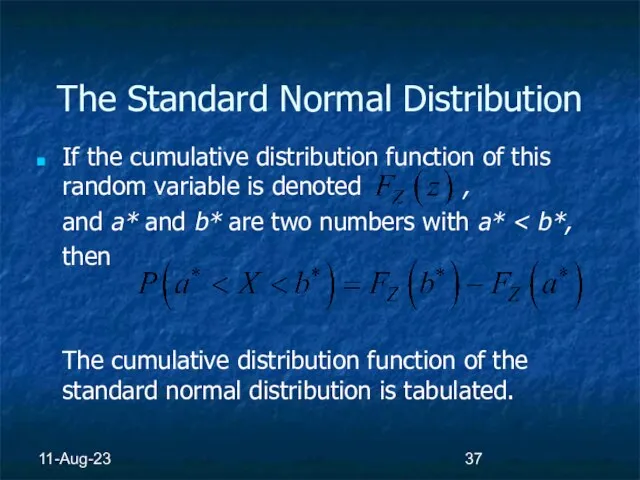
- 37. 11-Aug-23 The Standard Normal Distribution If the cumulative distribution function of this random variable is denoted
- 38. 11-Aug-23 The table of Normal Distribution This table gives values of for nonnegative values of z.
- 39. 11-Aug-23
- 40. 11-Aug-23 Values of the cumulative distribution function for negative values of z can be inferred from
- 41. 11-Aug-23 Probability density function for the standard normal random variable Z; the shaded areas, which are
- 42. 11-Aug-23 Moreover, since the total area under the curve is 1: Hence, it follows that For
- 43. 11-Aug-23 Example If Z is a standard normal random variable, find The required probability is Then,
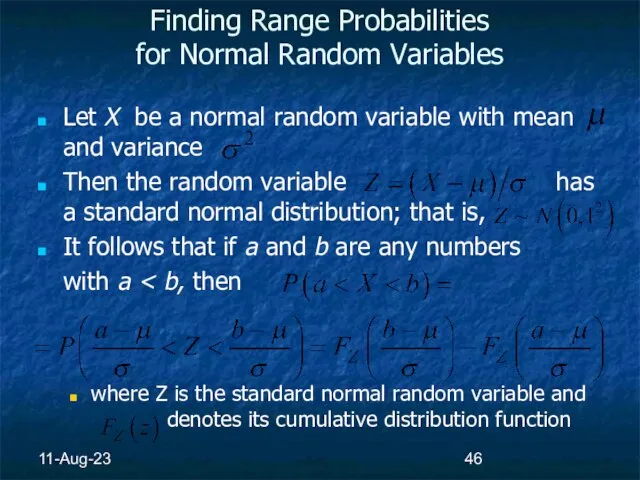
- 44. 11-Aug-23 How can probabilities for any normal random variable be expressed in terms of those for
- 45. 11-Aug-23 How can probabilities for any normal random variable be expressed in terms of those for
- 46. 11-Aug-23 Finding Range Probabilities for Normal Random Variables Let X be a normal random variable with
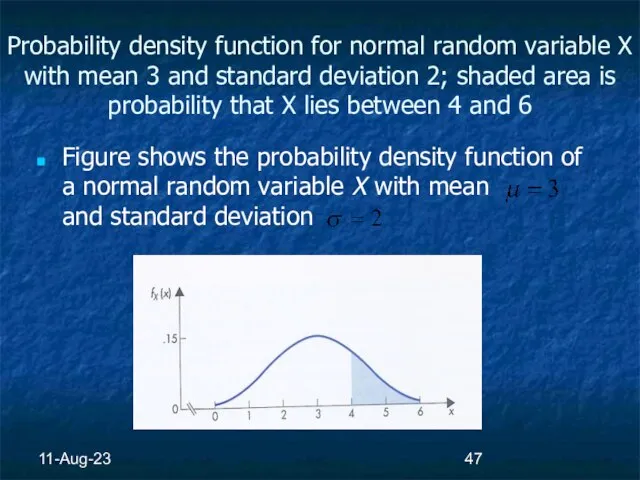
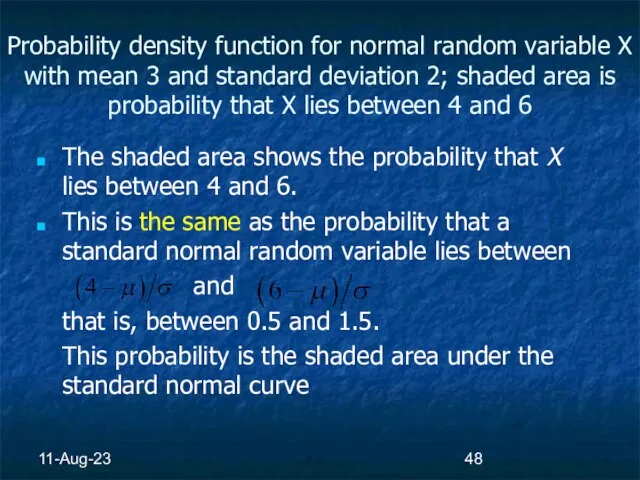
- 47. 11-Aug-23 Probability density function for normal random variable X with mean 3 and standard deviation 2;
- 48. 11-Aug-23 Probability density function for normal random variable X with mean 3 and standard deviation 2;
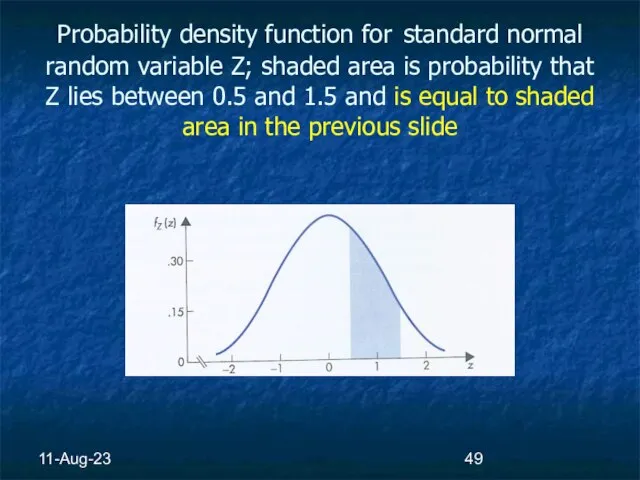
- 49. 11-Aug-23 Probability density function for standard normal random variable Z; shaded area is probability that Z
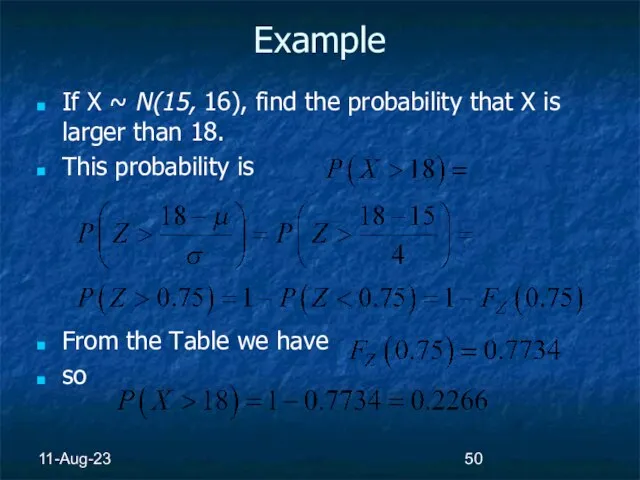
- 50. 11-Aug-23 Example If X ~ N(15, 16), find the probability that X is larger than 18.
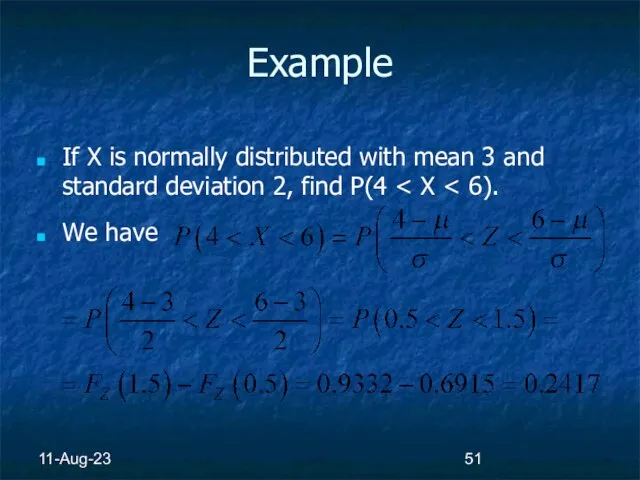
- 51. 11-Aug-23 Example If X is normally distributed with mean 3 and standard deviation 2, find P(4
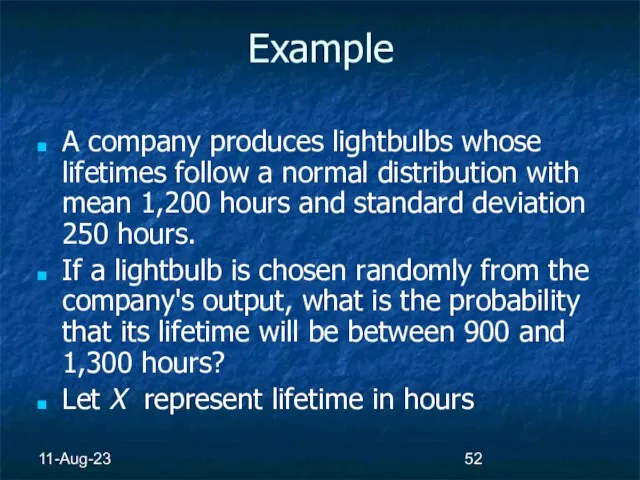
- 52. 11-Aug-23 Example A company produces lightbulbs whose lifetimes follow a normal distribution with mean 1,200 hours
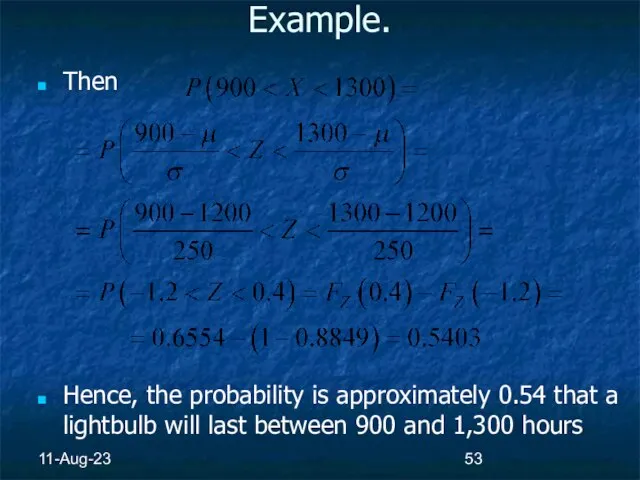
- 53. 11-Aug-23 Example. Then Hence, the probability is approximately 0.54 that a lightbulb will last between 900
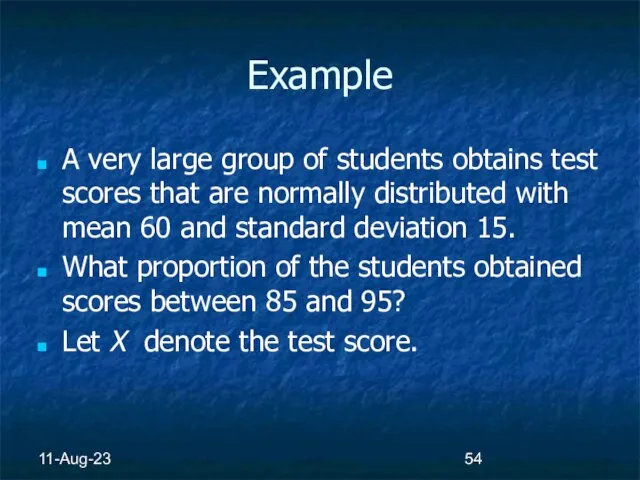
- 54. 11-Aug-23 Example A very large group of students obtains test scores that are normally distributed with
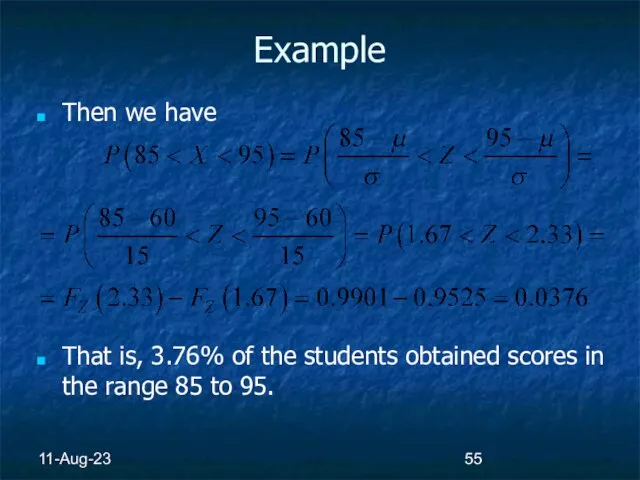
- 55. 11-Aug-23 Example Then we have That is, 3.76% of the students obtained scores in the range
- 56. 11-Aug-23 Example For the test scores of the previous Example, find the cutoff point for the
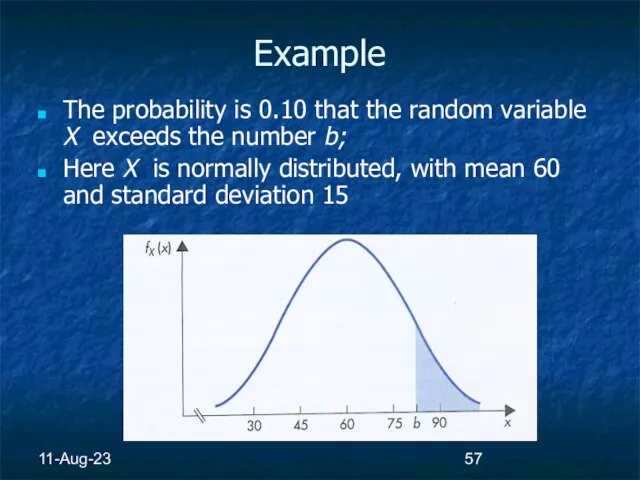
- 57. 11-Aug-23 Example The probability is 0.10 that the random variable X exceeds the number b; Here
- 58. 11-Aug-23 Example Let the number b denote the minimum score needed to be in the highest
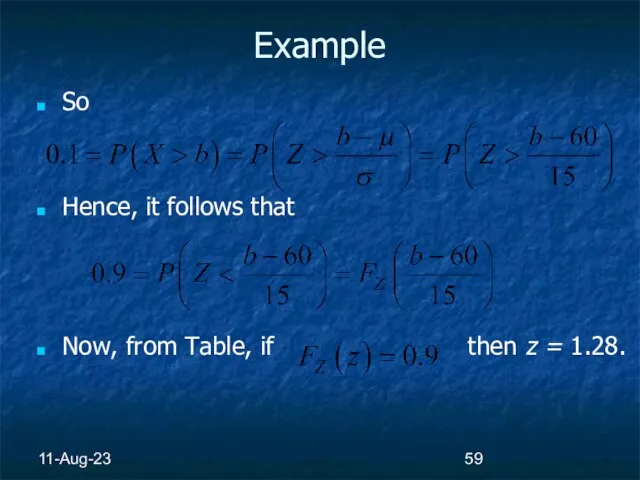
- 59. 11-Aug-23 Example So Hence, it follows that Now, from Table, if then z = 1.28.
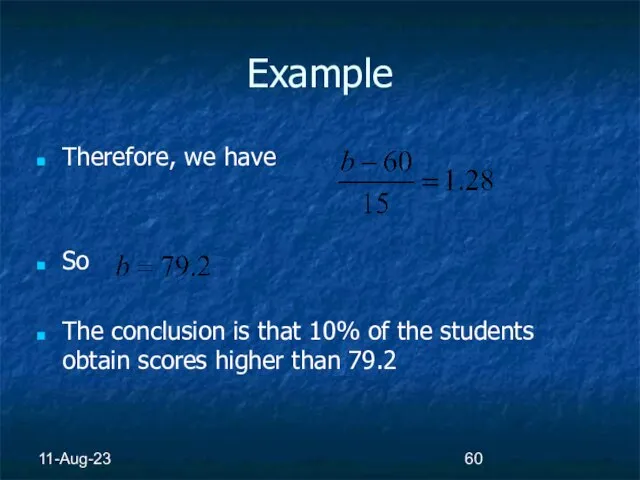
- 60. 11-Aug-23 Example Therefore, we have So The conclusion is that 10% of the students obtain scores
- 61. 11-Aug-23 Comments In Examples, if the scores awarded on the test were integers, the distribution of
- 63. Скачать презентацию
Слайд 311-Aug-23
Contents
Uniform distribution – the general view
The Normal Distribution
11-Aug-23
Contents
Uniform distribution – the general view
The Normal Distribution
Слайд 411-Aug-23
Uniform Distribution: general view
The random variable X is said to have uniform
11-Aug-23
Uniform Distribution: general view
The random variable X is said to have uniform
Слайд 511-Aug-23
To find the constant C:
We use the property of continuous random variable
(this
11-Aug-23
To find the constant C:
We use the property of continuous random variable
(this
Слайд 611-Aug-23
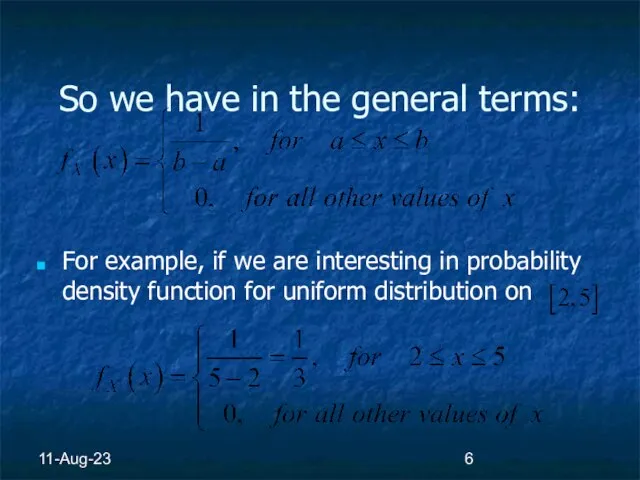
So we have in the general terms:
For example, if we are interesting
11-Aug-23
So we have in the general terms:
For example, if we are interesting
Слайд 711-Aug-23
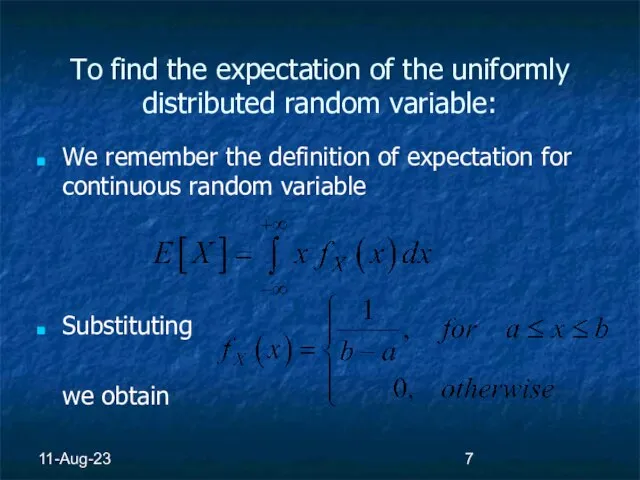
To find the expectation of the uniformly distributed random variable:
We remember the
11-Aug-23
To find the expectation of the uniformly distributed random variable:
We remember the
Слайд 811-Aug-23
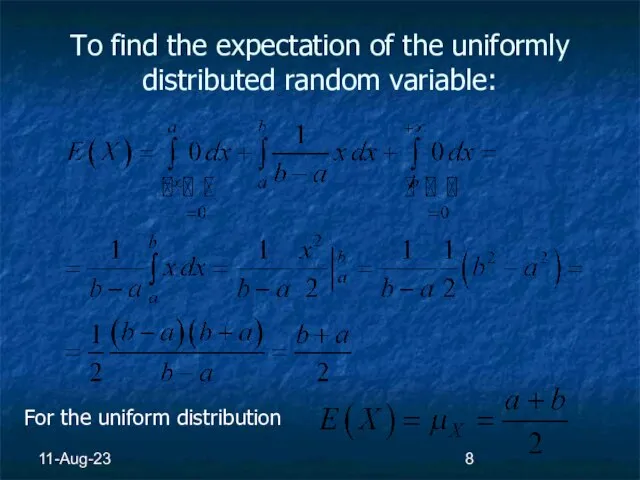
To find the expectation of the uniformly distributed random variable:
For the uniform
11-Aug-23
To find the expectation of the uniformly distributed random variable:
For the uniform
Слайд 911-Aug-23
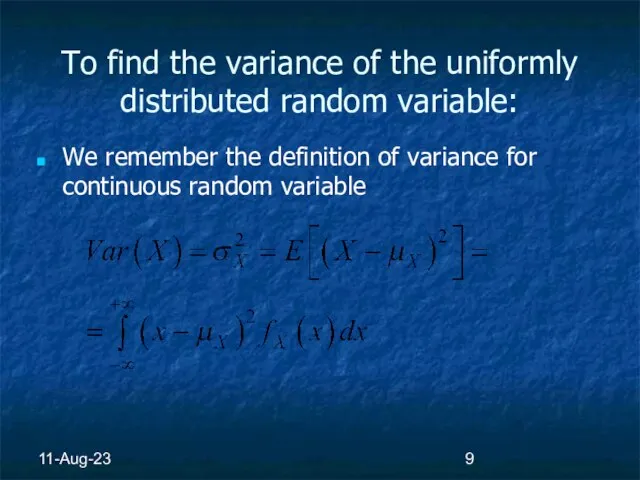
To find the variance of the uniformly distributed random variable:
We remember the
11-Aug-23
To find the variance of the uniformly distributed random variable:
We remember the
Слайд 1011-Aug-23
To find the variance of the uniformly distributed random variable:
Substituting the value
11-Aug-23
To find the variance of the uniformly distributed random variable:
Substituting the value
Слайд 1111-Aug-23
To find the variance of the uniformly distributed random variable:
11-Aug-23
To find the variance of the uniformly distributed random variable:
Слайд 1211-Aug-23
So the variance of the uniformly distributed random variable:
It could be calculated
11-Aug-23
So the variance of the uniformly distributed random variable:
It could be calculated
Слайд 1311-Aug-23
To find the cumulative distribution function for uniform distribution
We use the definition
11-Aug-23
To find the cumulative distribution function for uniform distribution
We use the definition
Слайд 1411-Aug-23
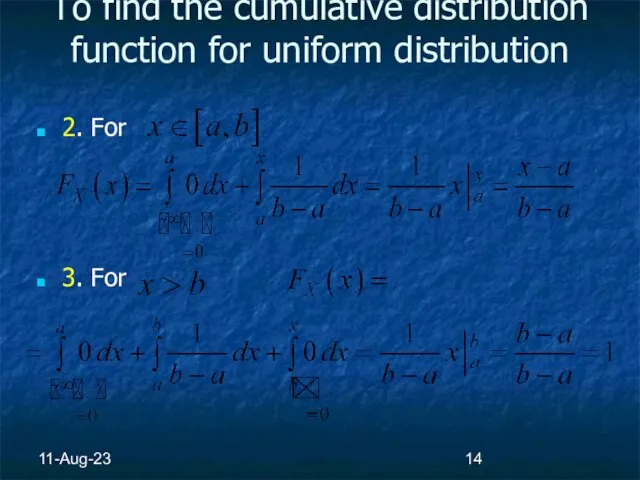
To find the cumulative distribution function for uniform distribution
2. For
3. For
11-Aug-23
To find the cumulative distribution function for uniform distribution
2. For
3. For
Слайд 1511-Aug-23
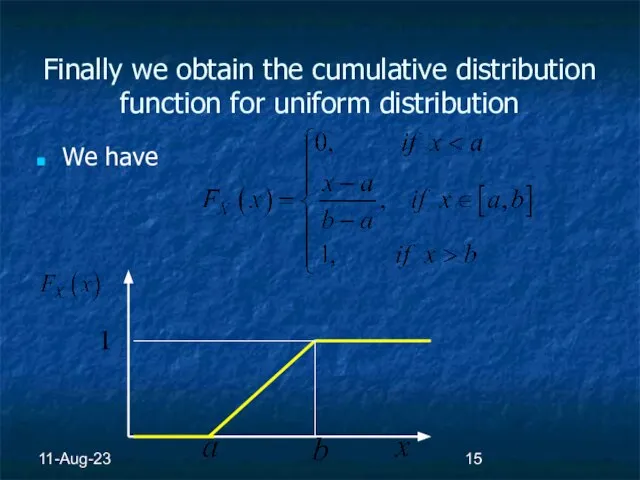
Finally we obtain the cumulative distribution function for uniform distribution
We have
11-Aug-23
Finally we obtain the cumulative distribution function for uniform distribution
We have
Слайд 1611-Aug-23
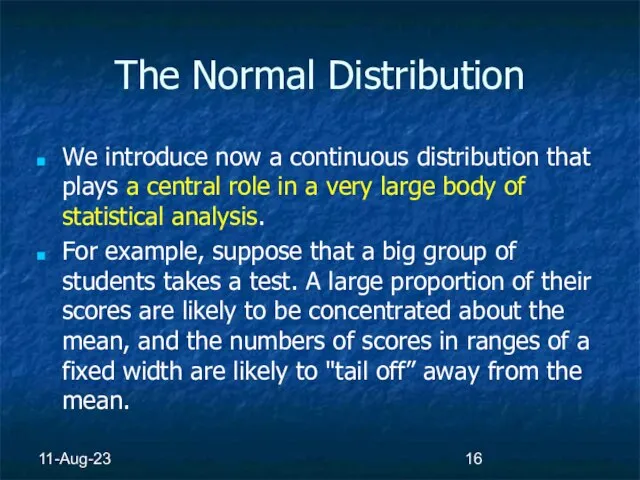
The Normal Distribution
We introduce now a continuous distribution that plays a
11-Aug-23
The Normal Distribution
We introduce now a continuous distribution that plays a
Слайд 1711-Aug-23
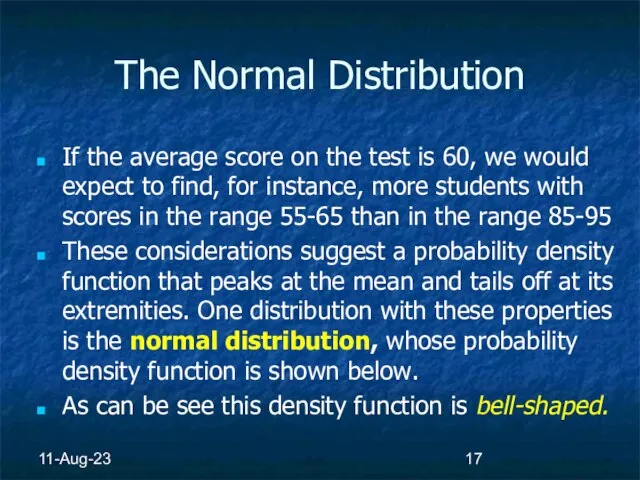
The Normal Distribution
If the average score on the test is 60, we
11-Aug-23
The Normal Distribution
If the average score on the test is 60, we
Слайд 1811-Aug-23
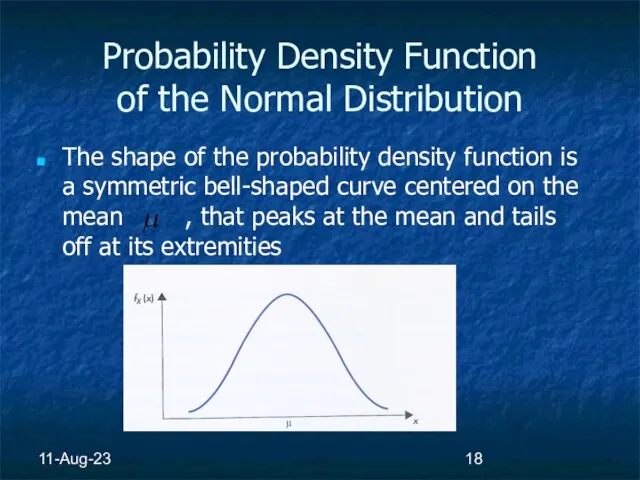
Probability Density Function
of the Normal Distribution
The shape of the probability density
11-Aug-23
Probability Density Function
of the Normal Distribution
The shape of the probability density
Слайд 1911-Aug-23
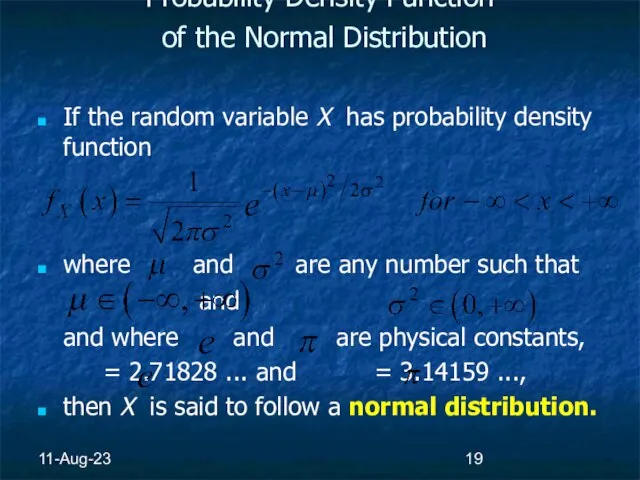
Probability Density Function
of the Normal Distribution
If the random variable X
11-Aug-23
Probability Density Function
of the Normal Distribution
If the random variable X
Слайд 2011-Aug-23
Comments
It can be seen from the definition that there is not a
11-Aug-23
Comments
It can be seen from the definition that there is not a
Слайд 2111-Aug-23
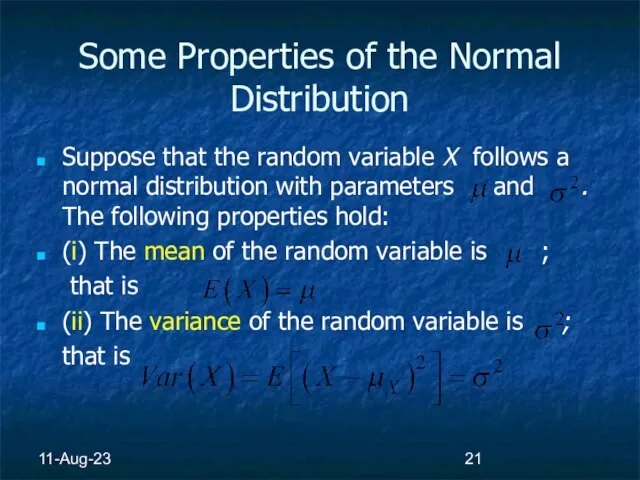
Some Properties of the Normal Distribution
Suppose that the random variable X follows
11-Aug-23
Some Properties of the Normal Distribution
Suppose that the random variable X follows
Слайд 2211-Aug-23
Some Properties of the Normal Distribution
(iii) The shape of the probability density
11-Aug-23
Some Properties of the Normal Distribution
(iii) The shape of the probability density
Слайд 2311-Aug-23
Comments & Notation
It follows from these properties that given the mean
11-Aug-23
Comments & Notation
It follows from these properties that given the mean
Слайд 2411-Aug-23
Comments
Now,
the mean of any distribution provides a measure of central location,
11-Aug-23
Comments
Now,
the mean of any distribution provides a measure of central location,
Слайд 2511-Aug-23
Comments
We shows probability density functions for two normal distributions with a common
11-Aug-23
Comments
We shows probability density functions for two normal distributions with a common
Слайд 2611-Aug-23
Comments
The two density functions are of normal random variables with a common
11-Aug-23
Comments
The two density functions are of normal random variables with a common
Слайд 2711-Aug-23
Cumulative Distribution Function of the Normal Distribution
An extremely important practical question concerns
11-Aug-23
Cumulative Distribution Function of the Normal Distribution
An extremely important practical question concerns
Слайд 2811-Aug-23
Cumulative Distribution Function of the Normal Distribution
Suppose that X is a normal
11-Aug-23
Cumulative Distribution Function of the Normal Distribution
Suppose that X is a normal
Слайд 2911-Aug-23
Cumulative Distribution Function of the Normal Distribution
The shaded area is the probability
11-Aug-23
Cumulative Distribution Function of the Normal Distribution
The shaded area is the probability
Слайд 3011-Aug-23
Cumulative Distribution Function of the Normal Distribution
There is no simple algebraic expression
11-Aug-23
Cumulative Distribution Function of the Normal Distribution
There is no simple algebraic expression
Слайд 3111-Aug-23
Cumulative Distribution Function
of the Normal Distribution
The general shape of the cumulative
11-Aug-23
Cumulative Distribution Function
of the Normal Distribution
The general shape of the cumulative
Слайд 3211-Aug-23
Range Probabilities
for Normal Random Variables
We have already seen
that for
11-Aug-23
Range Probabilities
for Normal Random Variables
We have already seen
that for
Слайд 3311-Aug-23
Range Probabilities
for Normal Random Variables
Let X be a normal random variable
11-Aug-23
Range Probabilities
for Normal Random Variables
Let X be a normal random variable
Слайд 3411-Aug-23
Range Probabilities
for Normal Random Variables
Any required probability can be obtained from
11-Aug-23
Range Probabilities
for Normal Random Variables
Any required probability can be obtained from
Слайд 3511-Aug-23
Range Probabilities
for Normal Random Variables
However, it would be enormously tedious if
11-Aug-23
Range Probabilities
for Normal Random Variables
However, it would be enormously tedious if
Слайд 3611-Aug-23
The Standard Normal Distribution
We now introduce the particular distribution that is used
11-Aug-23
The Standard Normal Distribution
We now introduce the particular distribution that is used
Слайд 3711-Aug-23
The Standard Normal Distribution
If the cumulative distribution function of this random variable
11-Aug-23
The Standard Normal Distribution
If the cumulative distribution function of this random variable
Слайд 3811-Aug-23
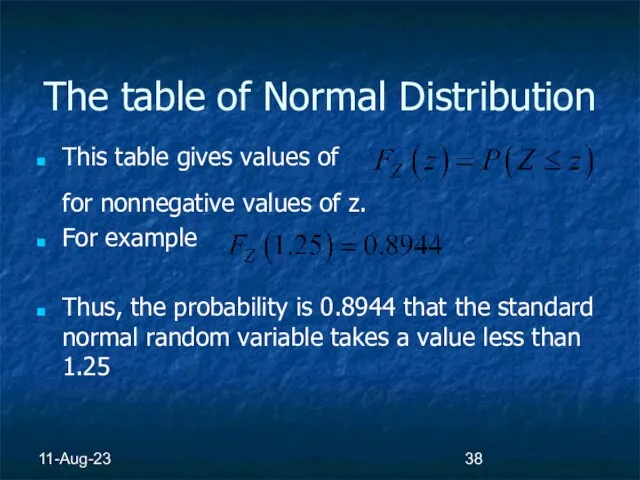
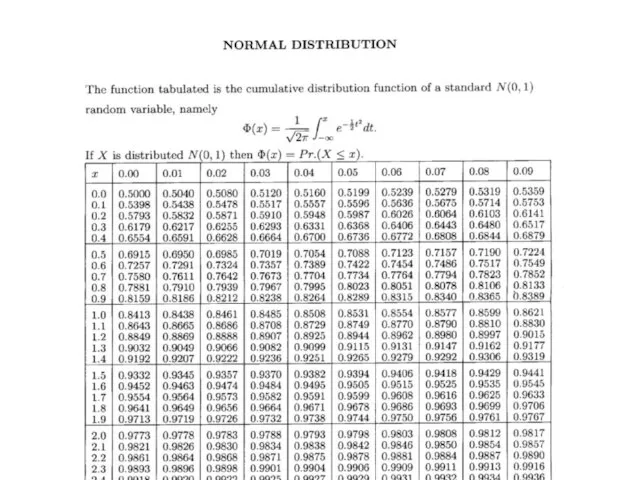
The table of Normal Distribution
This table gives values of
for nonnegative values of
11-Aug-23
The table of Normal Distribution
This table gives values of
for nonnegative values of
Слайд 3911-Aug-23
11-Aug-23
Слайд 4011-Aug-23
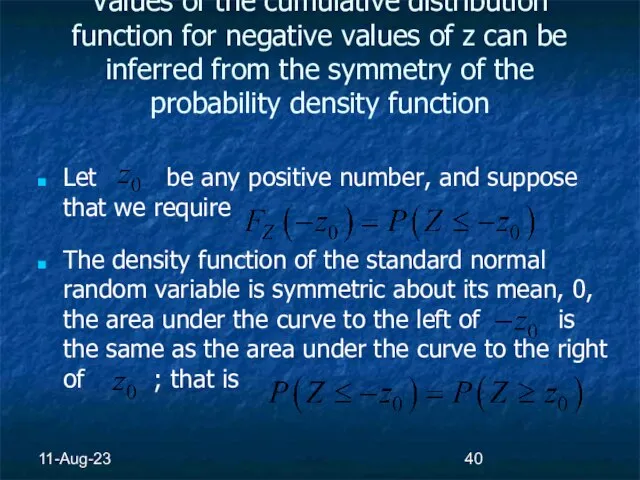
Values of the cumulative distribution function for negative values of z can
11-Aug-23
Values of the cumulative distribution function for negative values of z can
Слайд 4111-Aug-23
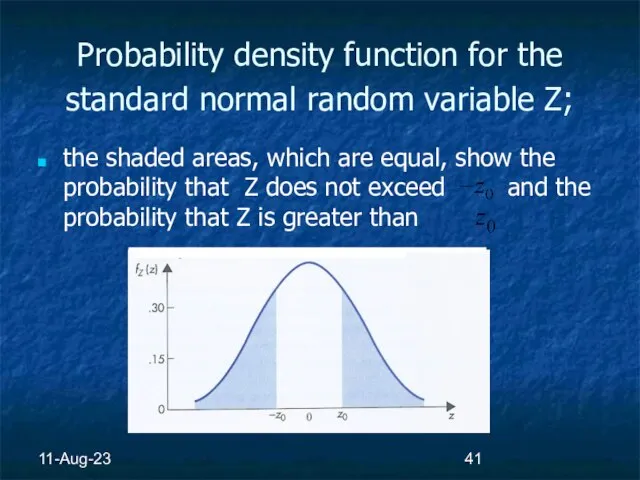
Probability density function for the standard normal random variable Z;
the shaded
11-Aug-23
Probability density function for the standard normal random variable Z;
the shaded
Слайд 4211-Aug-23
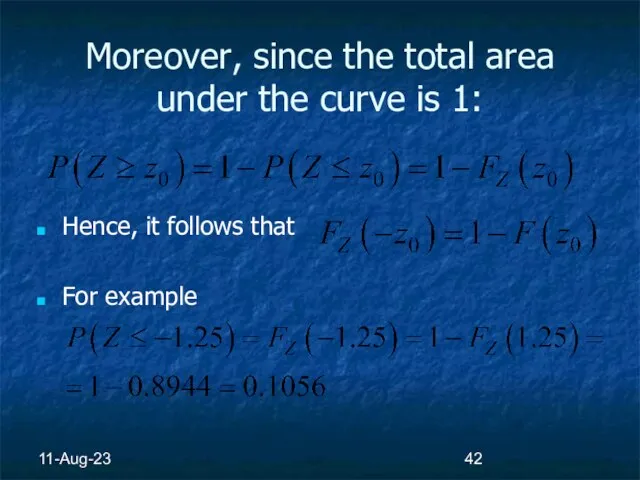
Moreover, since the total area under the curve is 1:
Hence, it follows
11-Aug-23
Moreover, since the total area under the curve is 1:
Hence, it follows
Слайд 4311-Aug-23
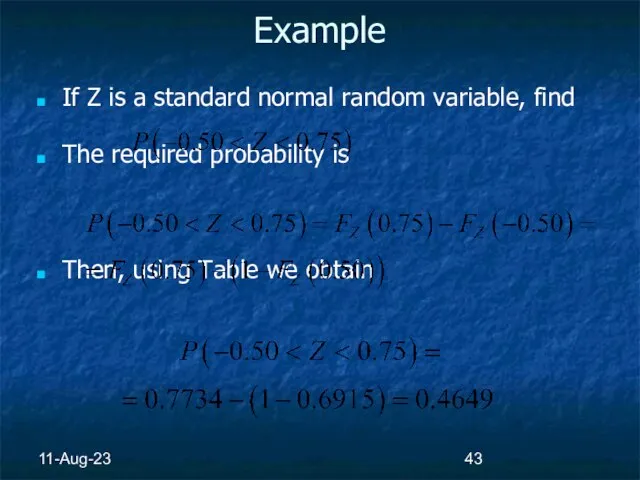
Example
If Z is a standard normal random variable, find
The required probability is
11-Aug-23
Example
If Z is a standard normal random variable, find
The required probability is
Слайд 4411-Aug-23
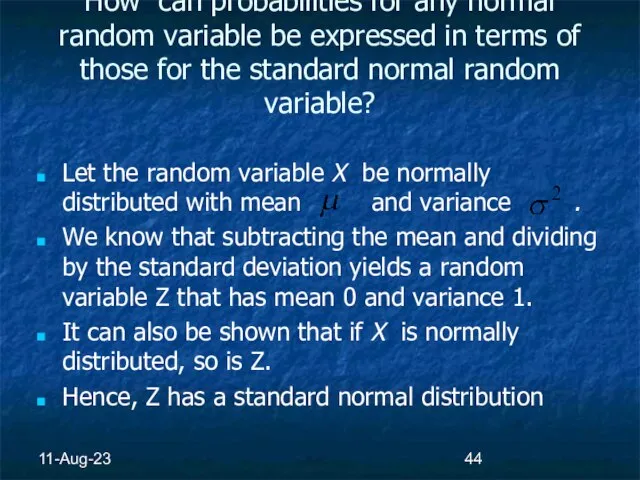
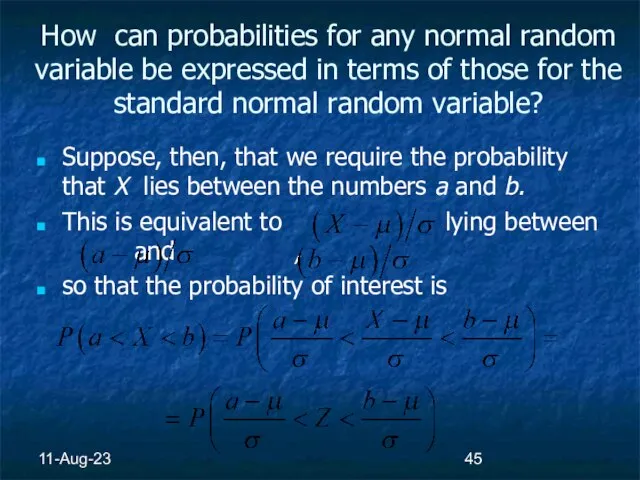
How can probabilities for any normal random variable be expressed in terms
11-Aug-23
How can probabilities for any normal random variable be expressed in terms
Слайд 4511-Aug-23
How can probabilities for any normal random variable be expressed in terms
11-Aug-23
How can probabilities for any normal random variable be expressed in terms
Слайд 4611-Aug-23
Finding Range Probabilities
for Normal Random Variables
Let X be a normal random
11-Aug-23
Finding Range Probabilities
for Normal Random Variables
Let X be a normal random
Слайд 4711-Aug-23
Probability density function for normal random variable X with mean 3 and
11-Aug-23
Probability density function for normal random variable X with mean 3 and
Слайд 4811-Aug-23
Probability density function for normal random variable X with mean 3 and
11-Aug-23
Probability density function for normal random variable X with mean 3 and
Слайд 4911-Aug-23
Probability density function for standard normal random variable Z; shaded area is
11-Aug-23
Probability density function for standard normal random variable Z; shaded area is
Слайд 5011-Aug-23
Example
If X ~ N(15, 16), find the probability that X is larger
11-Aug-23
Example
If X ~ N(15, 16), find the probability that X is larger
Слайд 5111-Aug-23
Example
If X is normally distributed with mean 3 and standard deviation 2,
11-Aug-23
Example
If X is normally distributed with mean 3 and standard deviation 2,
Слайд 5211-Aug-23
Example
A company produces lightbulbs whose lifetimes follow a normal distribution with mean
11-Aug-23
Example
A company produces lightbulbs whose lifetimes follow a normal distribution with mean
Слайд 5311-Aug-23
Example.
Then
Hence, the probability is approximately 0.54 that a lightbulb will last between
11-Aug-23
Example.
Then
Hence, the probability is approximately 0.54 that a lightbulb will last between
Слайд 5411-Aug-23
Example
A very large group of students obtains test scores that are normally
11-Aug-23
Example
A very large group of students obtains test scores that are normally
Слайд 5511-Aug-23
Example
Then we have
That is, 3.76% of the students obtained scores in the
11-Aug-23
Example
Then we have
That is, 3.76% of the students obtained scores in the
Слайд 5611-Aug-23
Example
For the test scores of the previous Example, find the cutoff point
11-Aug-23
Example
For the test scores of the previous Example, find the cutoff point
Слайд 5711-Aug-23
Example
The probability is 0.10 that the random variable X exceeds the number
11-Aug-23
Example
The probability is 0.10 that the random variable X exceeds the number
Слайд 5811-Aug-23
Example
Let the number b denote the minimum score needed to be in
11-Aug-23
Example
Let the number b denote the minimum score needed to be in

Слайд 5911-Aug-23
Example
So
Hence, it follows that
Now, from Table, if then z = 1.28.
11-Aug-23
Example
So
Hence, it follows that
Now, from Table, if then z = 1.28.
Слайд 6011-Aug-23
Example
Therefore, we have
So
The conclusion is that 10% of the students obtain scores
11-Aug-23
Example
Therefore, we have
So
The conclusion is that 10% of the students obtain scores
Слайд 6111-Aug-23
Comments
In Examples, if the scores awarded on the test were integers,
11-Aug-23
Comments
In Examples, if the scores awarded on the test were integers,
 Алтайский государственный университет. Экономика. Программа возможностей для трудоустройства и продолжения обучения
 Право и имущественные отношения
  КПЗС
КПЗС Керамогранит – экологичный материал
 Презентация на тему Как разрушаются камни (3 класс)
 Альтернативная коммуникация при помощи жестов и мимики для неговорящих детей
 Источники финансирования проекта
 Показательная функция
 Автопортрет
 Essay General Information about United States of America
 Цветное тесто
 Дизайнерская одежда
 Синтаксические нормы. Нормы согласования и управления
 ПРЕЗЕНТАЦИЯ на родит собрание 11 класс
 ЕДИНСТВЕННЫЙ ПОСТАВЩИК
 Новогоднее угощение
 Функции развития отношений партнеров в предбрачном периоде (С.В. Ковалев)
 Сотовый телефон. Вреден ли он для здоровья 4 класс
 Горные породы. Образование горных пород
 Железо 9 класс
 Приближённые вычисления интегралов
 Гуля Королева
 Медицина
 Национальный фактор и его роль в политике
 Diving
 АО Барнаульская генерация. Преддипломная практика
 СОВЕТ МОЛОДЕЖИ ФГУП ФНПЦ НИИИС им. Ю.Е. Седакова
 Преобразования графиков тригонометрических функций 10 класс