- The Basic Theory Using Demand and Supply

Содержание
- 2. Key points Consumer surplus and producer surplus National welfare with no trade Welfare effects of free
- 3. 1. Demand & Consumer Surplus A Demand curve shows how much of a good consumers are
- 4. 1. Demand & Consumer Surplus Changes in these other things lead to shift of the demand
- 5. 1. Demand & Consumer surplus Consumer surplus The demand curve shows the maximum price the consumer
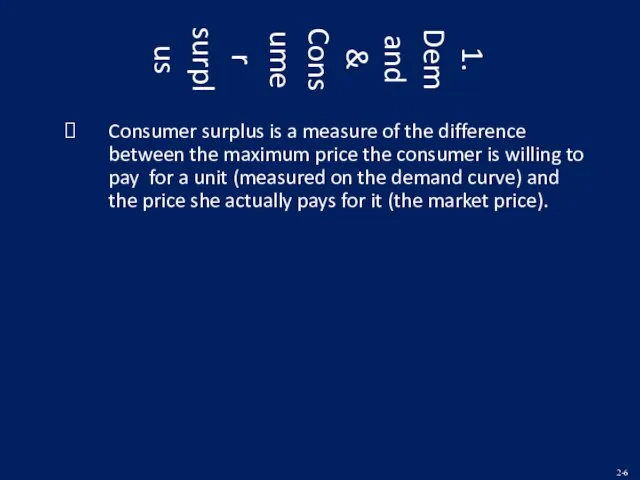
- 6. 1. Demand & Consumer surplus Consumer surplus is a measure of the difference between the maximum
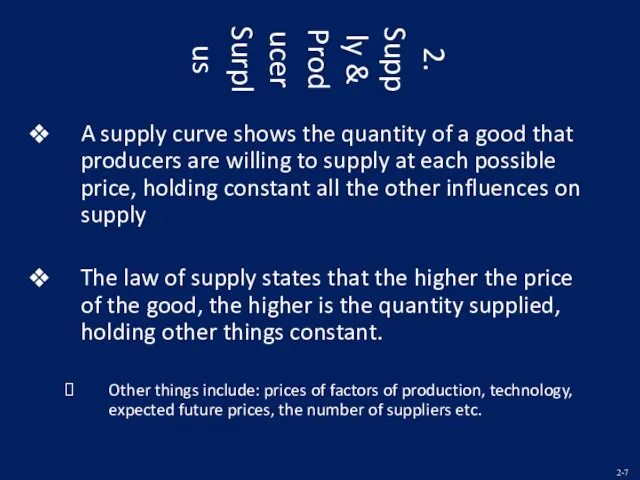
- 7. 2. Supply & Producer Surplus A supply curve shows the quantity of a good that producers
- 8. 2. Supply & Producer Surplus Changes in these other things lead to shift of the supply
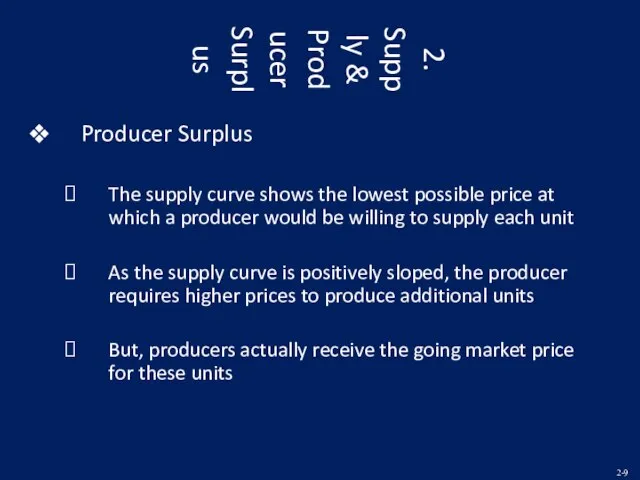
- 9. 2. Supply & Producer Surplus Producer Surplus The supply curve shows the lowest possible price at
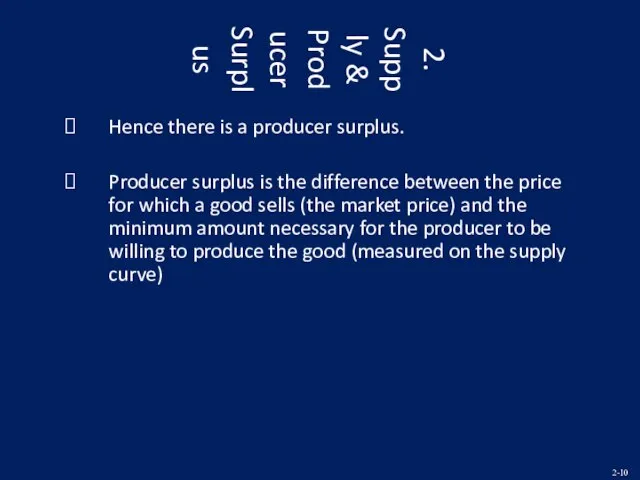
- 10. 2. Supply & Producer Surplus Hence there is a producer surplus. Producer surplus is the difference
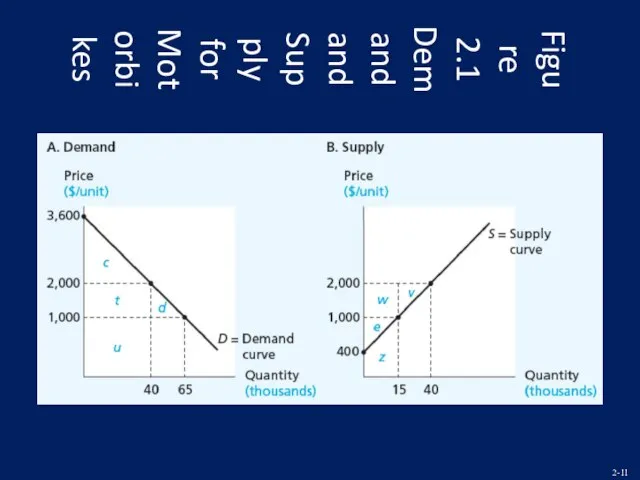
- 11. Figure 2.1 Demand and Supply for Motorbikes
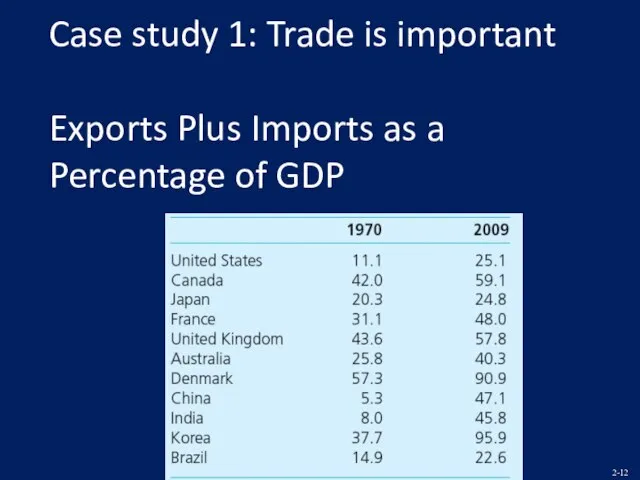
- 12. Case study 1: Trade is important Exports Plus Imports as a Percentage of GDP
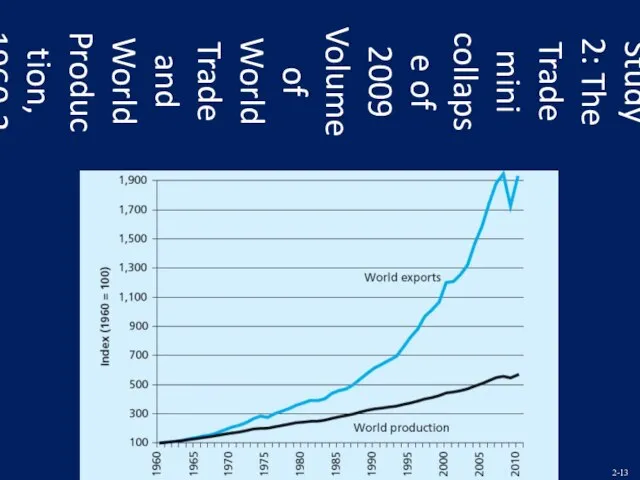
- 13. Case Study 2: The Trade mini collapse of 2009 Volume of World Trade and World Production,
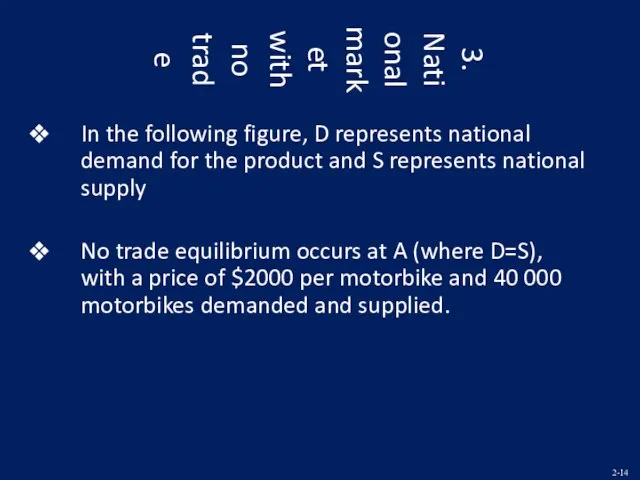
- 14. 3. National market with no trade In the following figure, D represents national demand for the
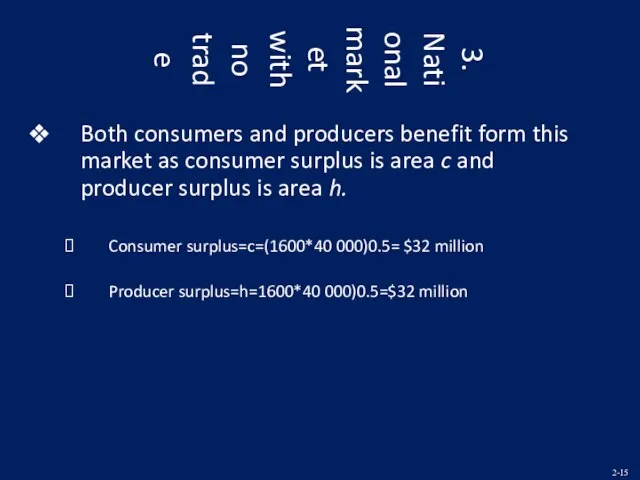
- 15. 3. National market with no trade Both consumers and producers benefit form this market as consumer
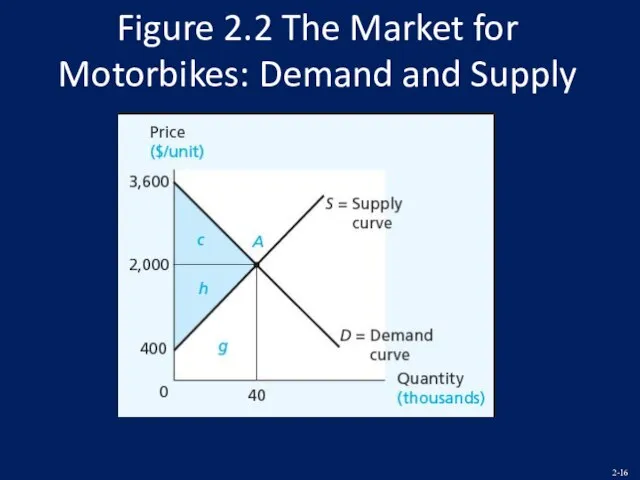
- 16. Figure 2.2 The Market for Motorbikes: Demand and Supply
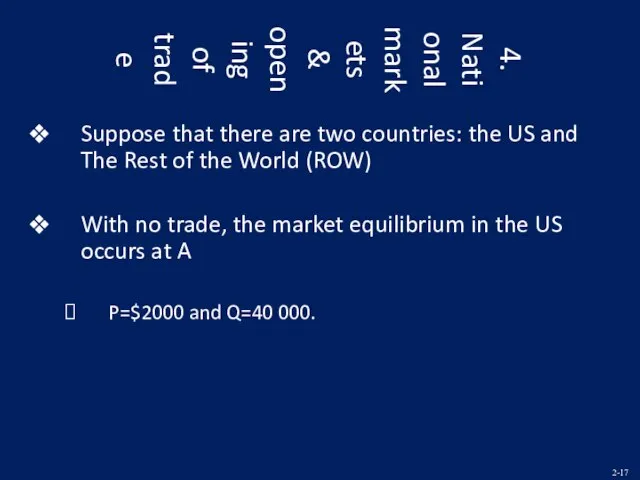
- 17. 4. National markets & opening of trade Suppose that there are two countries: the US and
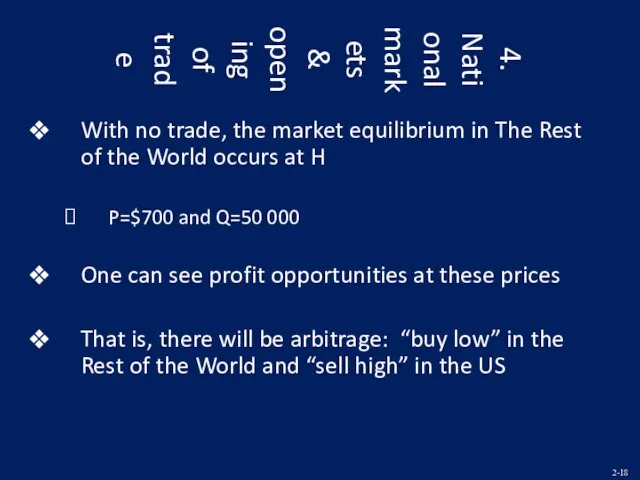
- 18. 4. National markets & opening of trade With no trade, the market equilibrium in The Rest
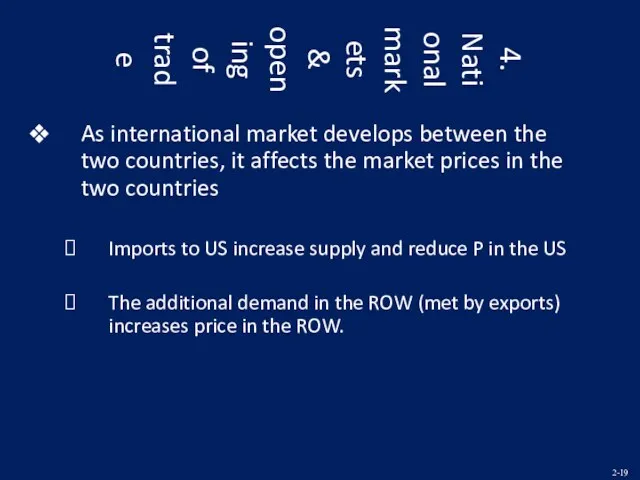
- 19. 4. National markets & opening of trade As international market develops between the two countries, it
- 20. 4. National markets & opening of trade If there are no transportation costs or other frictions,
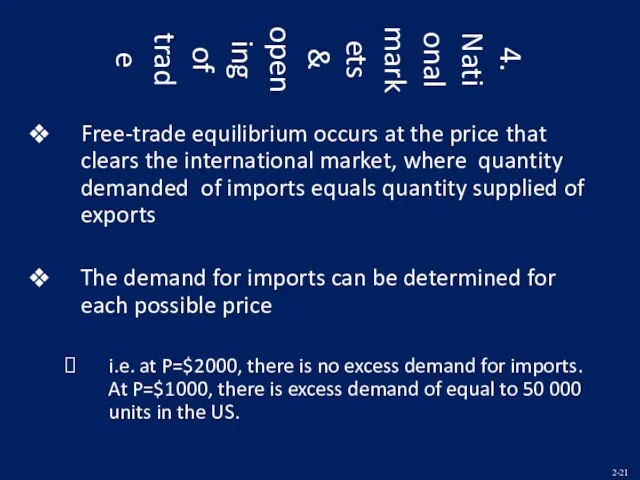
- 21. 4. National markets & opening of trade Free-trade equilibrium occurs at the price that clears the
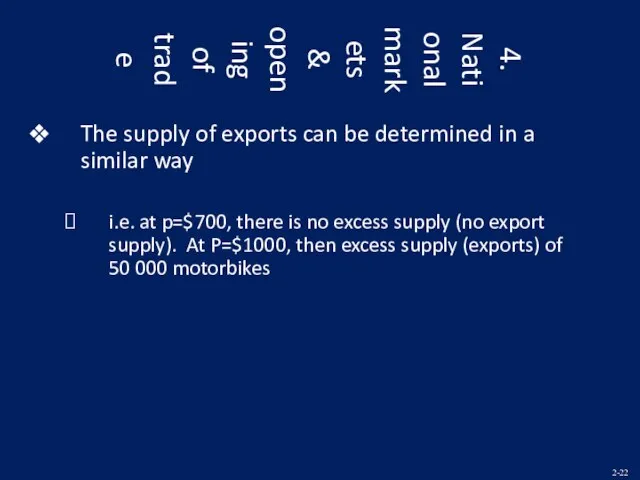
- 22. 4. National markets & opening of trade The supply of exports can be determined in a
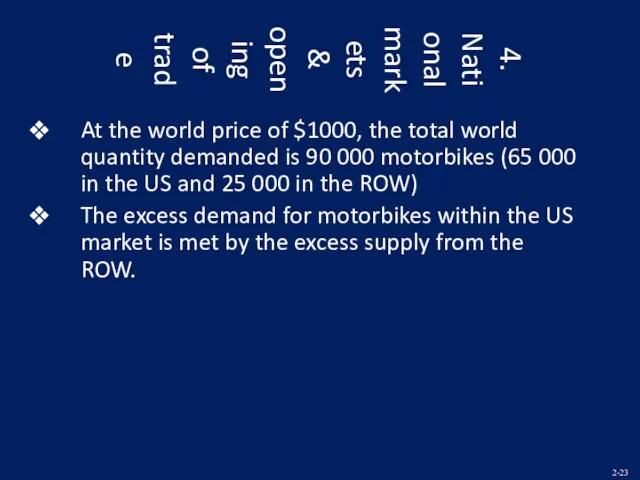
- 23. 4. National markets & opening of trade At the world price of $1000, the total world
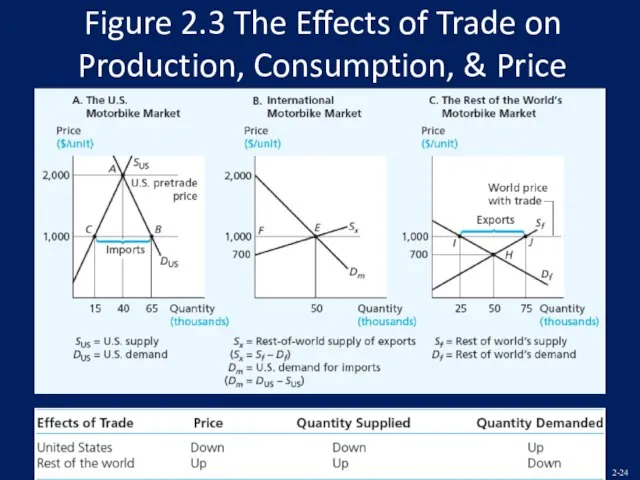
- 24. Figure 2.3 The Effects of Trade on Production, Consumption, & Price
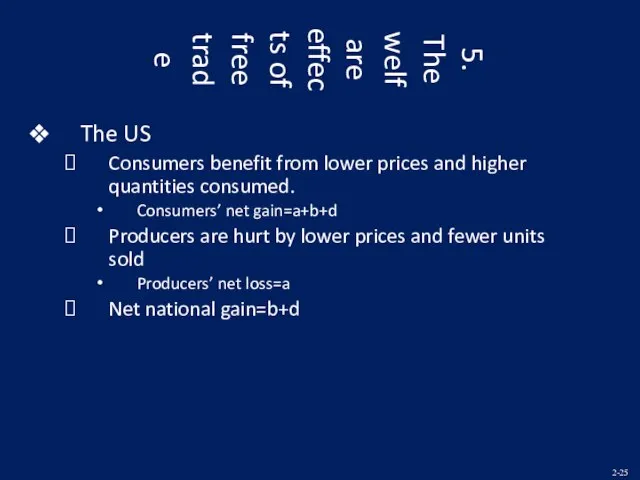
- 25. 5. The welfare effects of free trade The US Consumers benefit from lower prices and higher
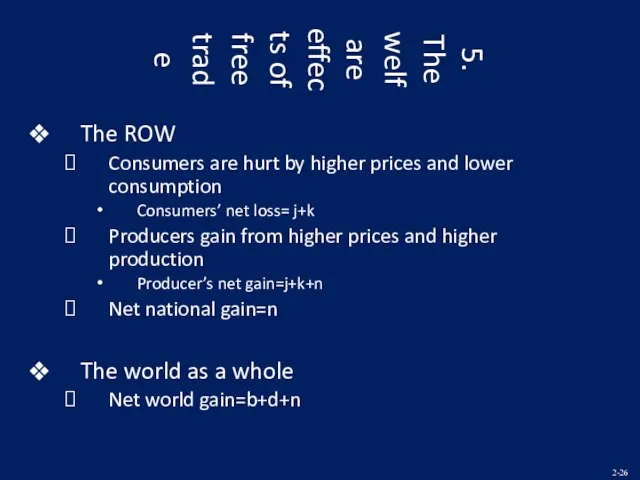
- 26. 5. The welfare effects of free trade The ROW Consumers are hurt by higher prices and
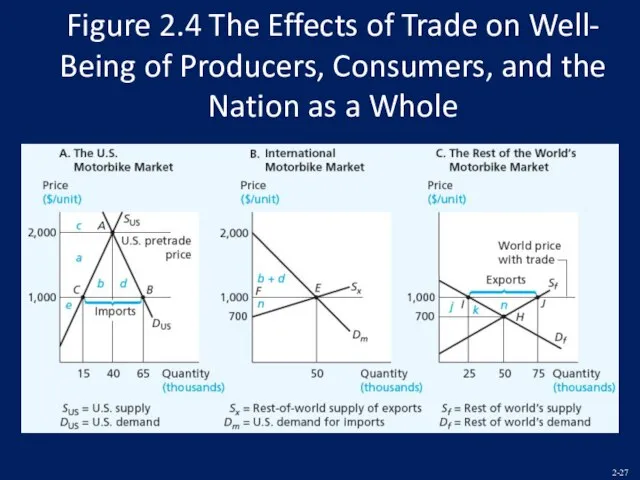
- 27. Figure 2.4 The Effects of Trade on Well- Being of Producers, Consumers, and the Nation as
- 29. Скачать презентацию
Слайд 2Key points
Consumer surplus and producer surplus
National welfare with no trade
Welfare effects
Key points
Consumer surplus and producer surplus
National welfare with no trade
Welfare effects
Слайд 31. Demand & Consumer Surplus
A Demand curve shows how much of a
1. Demand & Consumer Surplus
A Demand curve shows how much of a
Слайд 41. Demand & Consumer Surplus
Changes in these other things lead to shift
1. Demand & Consumer Surplus
Changes in these other things lead to shift
Слайд 51. Demand & Consumer surplus
Consumer surplus
The demand curve shows the maximum price
1. Demand & Consumer surplus
Consumer surplus
The demand curve shows the maximum price
Слайд 61. Demand & Consumer surplus
Consumer surplus is a measure of the difference
1. Demand & Consumer surplus
Consumer surplus is a measure of the difference
Слайд 72. Supply & Producer Surplus
A supply curve shows the quantity of a
2. Supply & Producer Surplus
A supply curve shows the quantity of a
Слайд 82. Supply & Producer Surplus
Changes in these other things lead to shift
2. Supply & Producer Surplus
Changes in these other things lead to shift
Слайд 92. Supply & Producer Surplus
Producer Surplus
The supply curve shows the lowest possible
2. Supply & Producer Surplus
Producer Surplus
The supply curve shows the lowest possible
Слайд 102. Supply & Producer Surplus
Hence there is a producer surplus.
Producer surplus is
2. Supply & Producer Surplus
Hence there is a producer surplus.
Producer surplus is
Слайд 11Figure 2.1 Demand and Supply for Motorbikes
Figure 2.1 Demand and Supply for Motorbikes
Слайд 12Case study 1: Trade is important
Exports Plus Imports as a Percentage of
Case study 1: Trade is important
Exports Plus Imports as a Percentage of
Слайд 13Case Study 2: The Trade mini collapse of 2009
Volume of World Trade
Case Study 2: The Trade mini collapse of 2009 Volume of World Trade
Слайд 143. National market with no trade
In the following figure, D represents national
3. National market with no trade
In the following figure, D represents national
Слайд 153. National market with no trade
Both consumers and producers benefit form this
3. National market with no trade
Both consumers and producers benefit form this
Слайд 16Figure 2.2 The Market for Motorbikes: Demand and Supply
Figure 2.2 The Market for Motorbikes: Demand and Supply
Слайд 174. National markets & opening of trade
Suppose that there are two countries:
4. National markets & opening of trade
Suppose that there are two countries:
Слайд 184. National markets & opening of trade
With no trade, the market equilibrium
4. National markets & opening of trade
With no trade, the market equilibrium
Слайд 194. National markets & opening of trade
As international market develops between the
4. National markets & opening of trade
As international market develops between the
Слайд 204. National markets & opening of trade
If there are no transportation costs
4. National markets & opening of trade
If there are no transportation costs
Слайд 214. National markets & opening of trade
Free-trade equilibrium occurs at the price
4. National markets & opening of trade
Free-trade equilibrium occurs at the price
Слайд 224. National markets & opening of trade
The supply of exports can be
4. National markets & opening of trade
The supply of exports can be
Слайд 234. National markets & opening of trade
At the world price of $1000,
4. National markets & opening of trade
At the world price of $1000,
Слайд 24Figure 2.3 The Effects of Trade on Production, Consumption, & Price
Figure 2.3 The Effects of Trade on Production, Consumption, & Price
Слайд 255. The welfare effects of free trade
The US
Consumers benefit from lower prices
5. The welfare effects of free trade
The US
Consumers benefit from lower prices
Слайд 265. The welfare effects of free trade
The ROW
Consumers are hurt by higher
5. The welfare effects of free trade
The ROW
Consumers are hurt by higher
Слайд 27Figure 2.4 The Effects of Trade on Well- Being of Producers, Consumers,
Figure 2.4 The Effects of Trade on Well- Being of Producers, Consumers,
 Обмен, торговля, реклама
 Безработица
 Comprehensive urban planing
 Типичные задачи по банковскому делу
 Введение в экономику (Л2)
 Общественные блага и принципы их классификации
 Квиз. Глобализация
 Безработица: причины и последствия
 Анализ дебиторской задолженности (на примере ООО Антратэк)
 Конкуренция, 11 кл
 Предмет, методы и функции экономической теории
 Платежный баланс
 Внутренний контроль в негосударственных пенсионных фондах
 Экономика информационного общества
 Tihanovskaya in Brussels called on the EU to impose sanctions
 Прибыль и доход предприятия
 Экономика и экономическая наука
 Монополистическая бюрократия: базовые модели. Тема 5
 История налогов
 Экономический рост и развитие
 Безработица и неравенство
 Проект Реформация
 Өзін – өзі қамтамасыз ететін көше бағанасы
 Разработка ИС для управления запасами компании по продаже хрустальных и стекольных изделий
 Процедура взаимодействия СК с поставщиками по сервису (Мониторинг KPI и производственный аудит)
 Постолимпийский Сочи. Сегодня и завтра
 Країни Європи Третинний сектор економіки
 Научные основы социально-экономической статистики