- Applications of raman luminescence spectroscopy in tumor diagnosis

Содержание
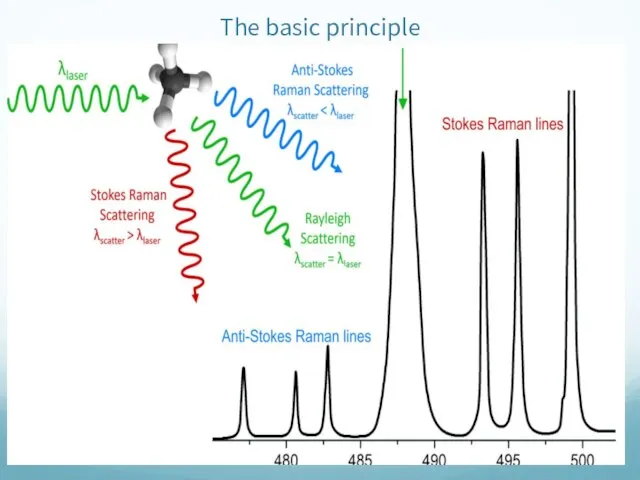
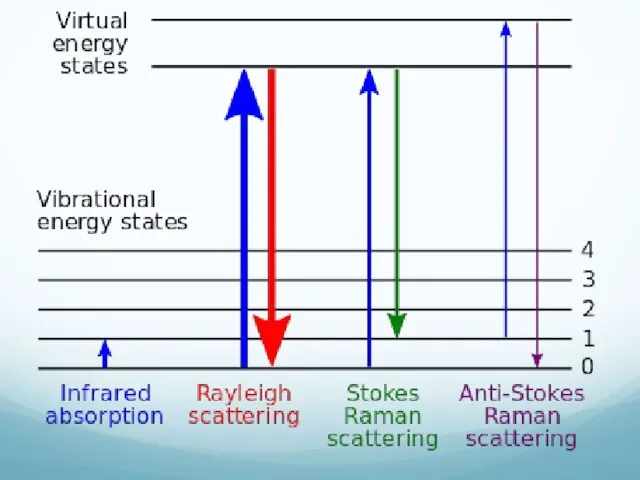
- 2. The basic principle
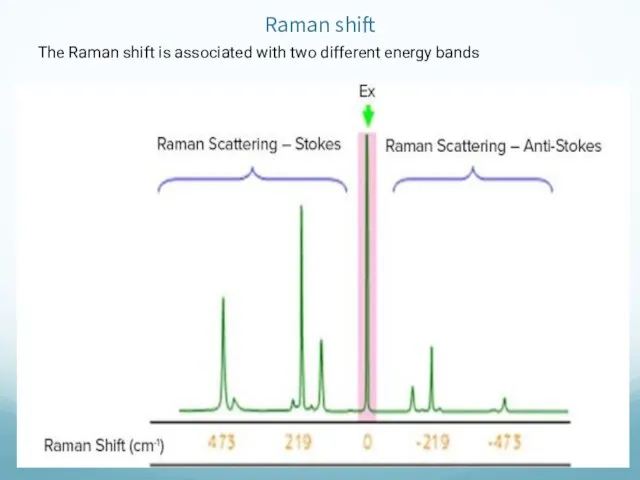
- 4. Raman shift The Raman shift is associated with two different energy bands
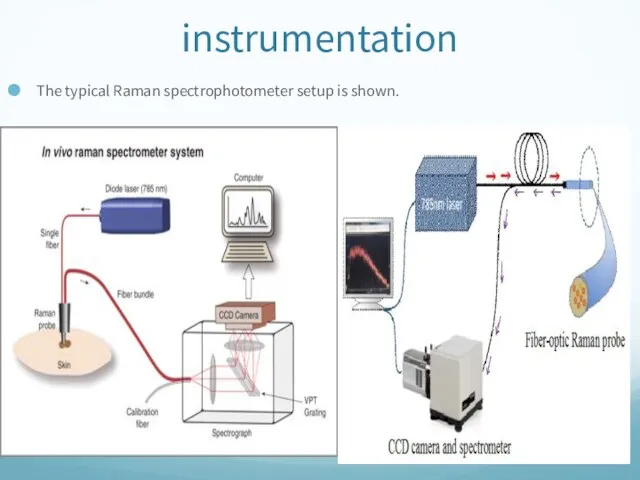
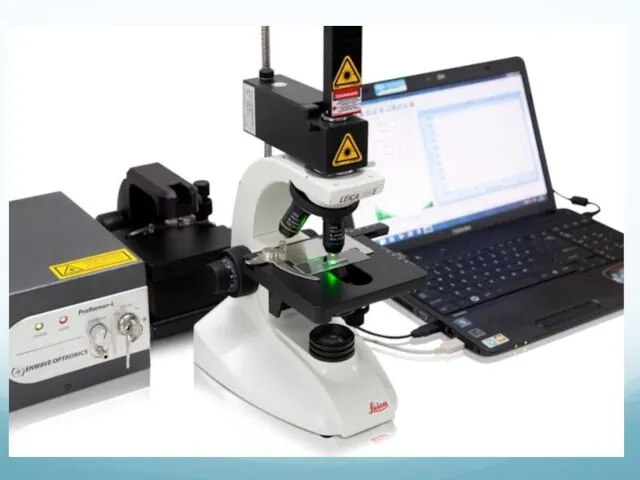
- 6. instrumentation The typical Raman spectrophotometer setup is shown.
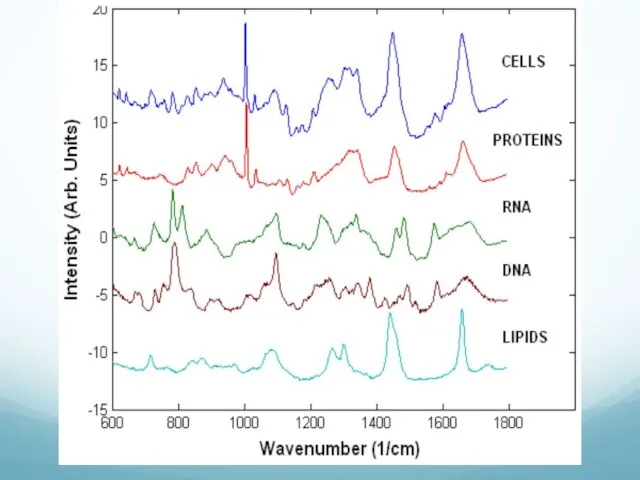
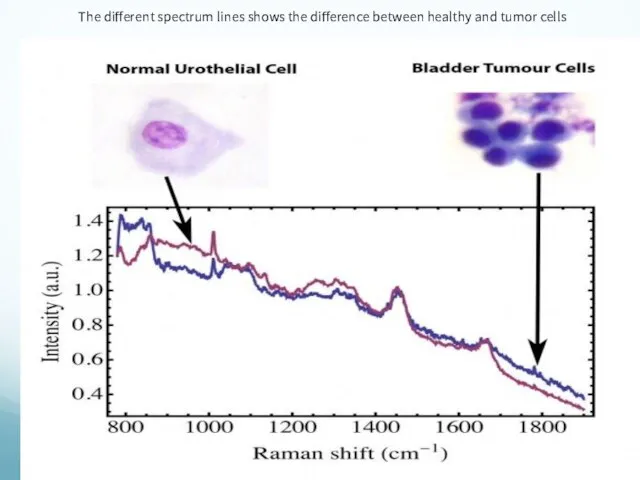
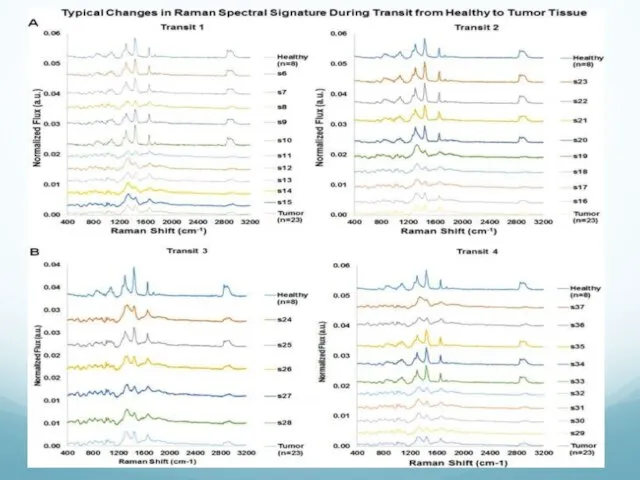
- 8. The different spectrum lines shows the difference between healthy and tumor cells
- 10. Oral cancer detection
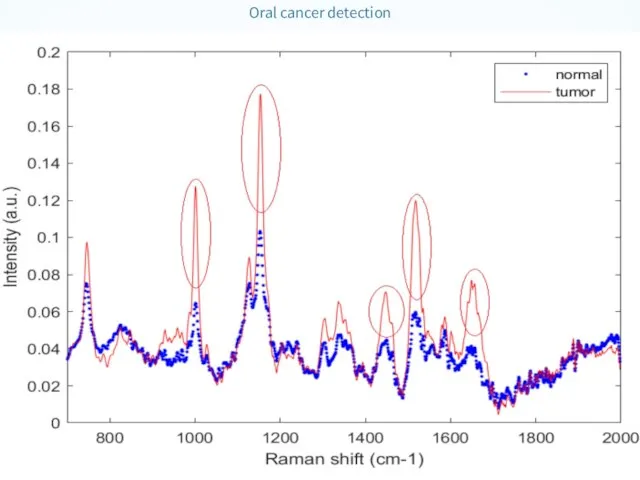
- 11. Oral cancer detection
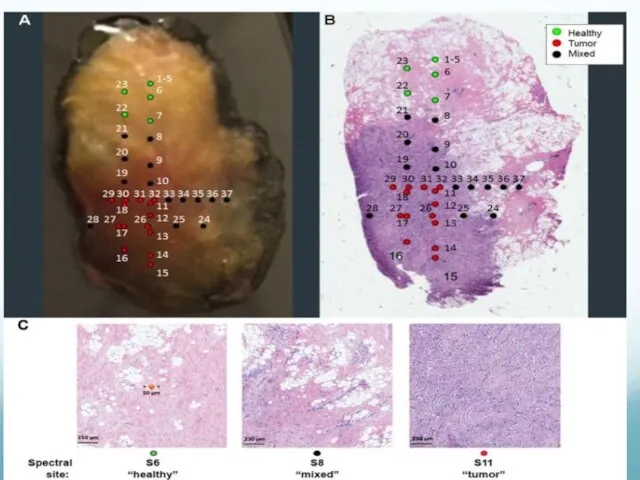
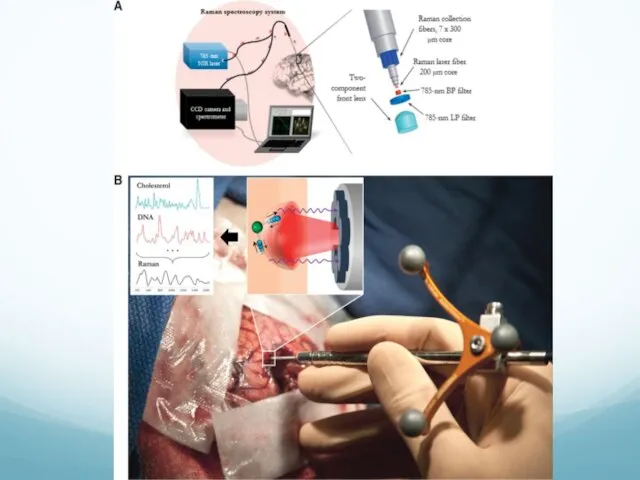
- 12. Margin analysis during breast cancer lumpectomy
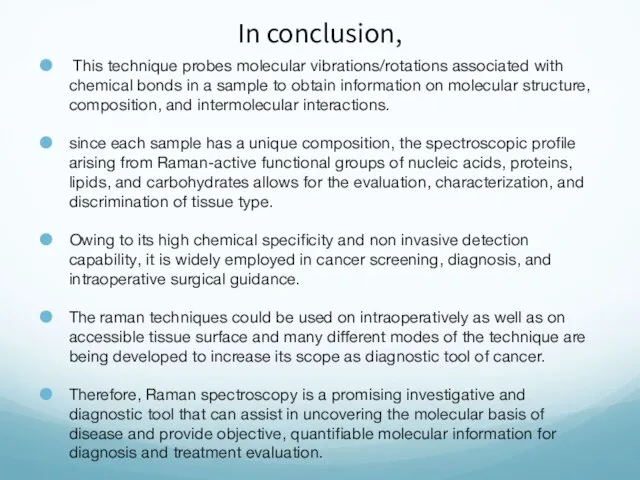
- 17. In conclusion, This technique probes molecular vibrations/rotations associated with chemical bonds in a sample to obtain
- 18. references Slide 1-9 -https://www.ncbi.nlm.nih.gov/pmc/articles/PMC6066646/ https://chem.libretexts.org/Bookshelves/Analytical_Chemistry/Book%3A_Molecular_and_Atomic_Spectroscopy_(Wenzel)/5%3A_Raman_Spectroscopy https://www.jasco-global.com/principle/principles-of-raman-spectroscopy-4-history-of-raman-spectroscopy/ Slide 10,11 - https://www.mdpi.com/2077-0383/8/9/1313/htm Slide12,13,14 - https://www.nature.com/articles/s41598-019-51112-0 Additional-https://www.tandfonline.com/doi/full/10.1080/14737159.2020.1724092 https://pubmed.ncbi.nlm.nih.gov/30569241/
- 20. Скачать презентацию
Слайд 4Raman shift
The Raman shift is associated with two different energy bands
Raman shift
The Raman shift is associated with two different energy bands
Слайд 6instrumentation
The typical Raman spectrophotometer setup is shown.
instrumentation
The typical Raman spectrophotometer setup is shown.
Слайд 8The different spectrum lines shows the difference between healthy and tumor cells
The different spectrum lines shows the difference between healthy and tumor cells
Слайд 10Oral cancer detection
Oral cancer detection
Слайд 11Oral cancer detection
Oral cancer detection
Слайд 12Margin analysis during breast cancer lumpectomy
Margin analysis during breast cancer lumpectomy
Слайд 17In conclusion,
This technique probes molecular vibrations/rotations associated with chemical bonds in
In conclusion,
This technique probes molecular vibrations/rotations associated with chemical bonds in
Слайд 18references
Slide 1-9 -https://www.ncbi.nlm.nih.gov/pmc/articles/PMC6066646/
https://chem.libretexts.org/Bookshelves/Analytical_Chemistry/Book%3A_Molecular_and_Atomic_Spectroscopy_(Wenzel)/5%3A_Raman_Spectroscopy
https://www.jasco-global.com/principle/principles-of-raman-spectroscopy-4-history-of-raman-spectroscopy/
Slide 10,11 - https://www.mdpi.com/2077-0383/8/9/1313/htm
Slide12,13,14 - https://www.nature.com/articles/s41598-019-51112-0
Additional-https://www.tandfonline.com/doi/full/10.1080/14737159.2020.1724092
https://pubmed.ncbi.nlm.nih.gov/30569241/
references
Slide 1-9 -https://www.ncbi.nlm.nih.gov/pmc/articles/PMC6066646/
https://chem.libretexts.org/Bookshelves/Analytical_Chemistry/Book%3A_Molecular_and_Atomic_Spectroscopy_(Wenzel)/5%3A_Raman_Spectroscopy
https://www.jasco-global.com/principle/principles-of-raman-spectroscopy-4-history-of-raman-spectroscopy/
Slide 10,11 - https://www.mdpi.com/2077-0383/8/9/1313/htm
Slide12,13,14 - https://www.nature.com/articles/s41598-019-51112-0
Additional-https://www.tandfonline.com/doi/full/10.1080/14737159.2020.1724092
https://pubmed.ncbi.nlm.nih.gov/30569241/
 Операции на конечностях. Операции на сосудах
 Ринопластика
 Урология
 Осман Илхам
 Внешние признаки гипотироза
 Лекарственные средства, применяемые при недостаточности коронарного кровообращения (антиангинальные средства)
 УЗ-диагностика узлов щитовидной железы
 КРАСНУХА
 Инфекционные заболевания и их профилактика
 Особенности проведения клинических исследований вакцинных препаратов
 Гнойные воспалительные заболевания придатков матки
 Глаза – окно в мир. Строение глаза
 лекция 4
 Атлас наследственных и генетических болезней
 Нейрорадиологический бестиарий
 Технология анализа химических свойств СМЖ с помощью тестовых полосок
 Анализ клинического течения климактерического синдрома
 Дистанционный киноклуб Природа
 Запретные упражнения
 Лихорадка Зика. Клиника, диагностика, лечение
 Тератомалар
 Латинские ботанические термины
 Команда Феникс. Задача №7. Клинический диагноз: Болезнь Иценко-Кушинга
 Применение биокомпозитных материалов в стоматологической имплантологии и реконструктивной хирургии полости рта
 Тромбоэмболия легочной артерий. Классификация и постановка диагноза
 Прямая офтальмоскопия
 СП при инфаркте миокарда
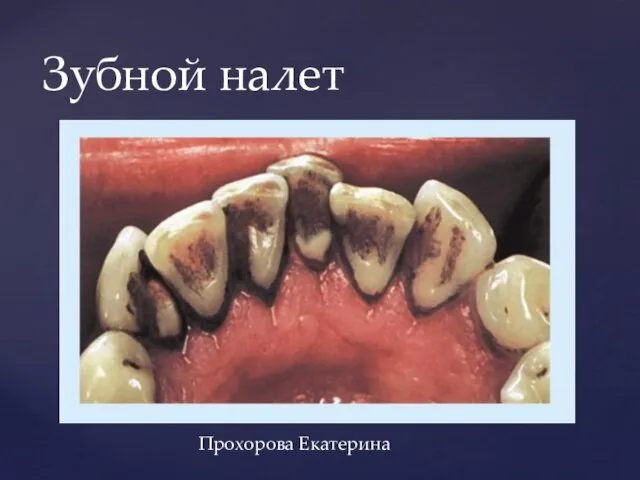 Зубной налет