- Compare means (paremetric tests)

Содержание
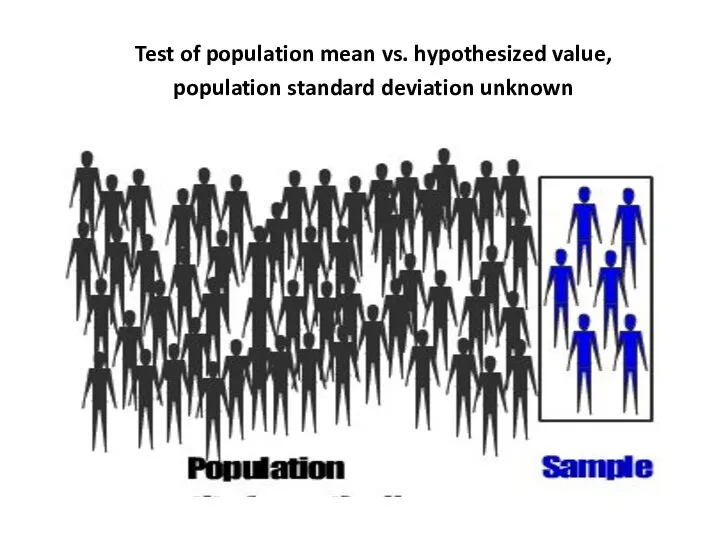
- 2. Test of population mean vs. hypothesized value, population standard deviation unknown
- 5. Exercise (13)
- 6. Exercise (13): It is known that the mean Haemoglobin percent (Hb%) of adult females in a
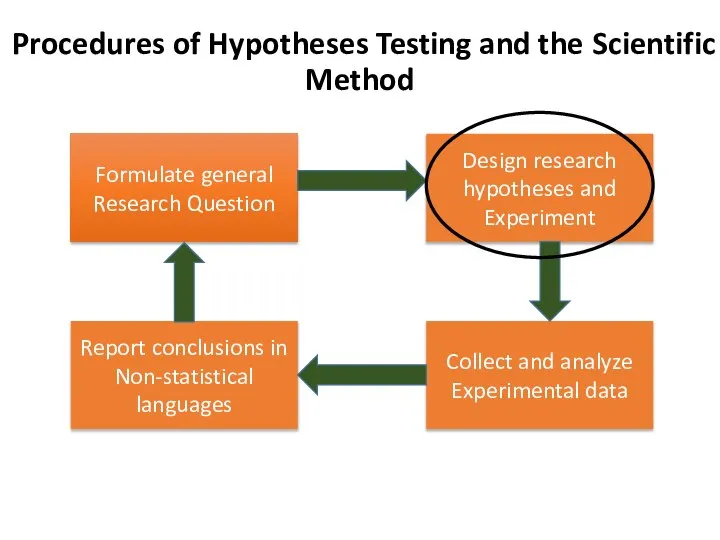
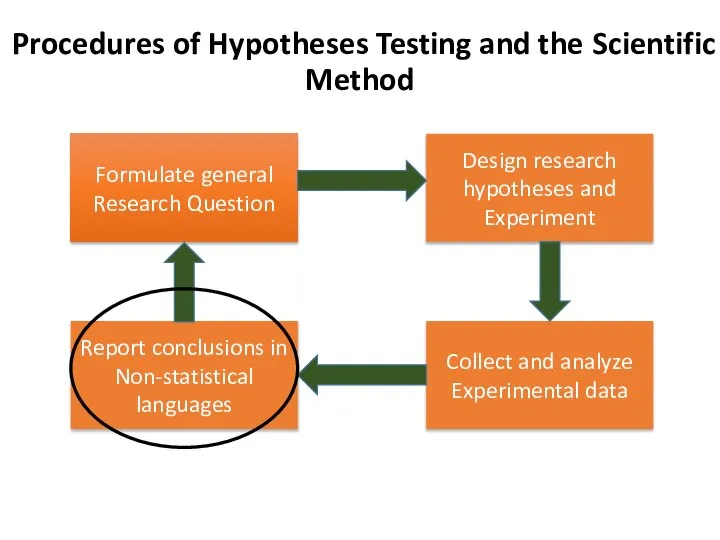
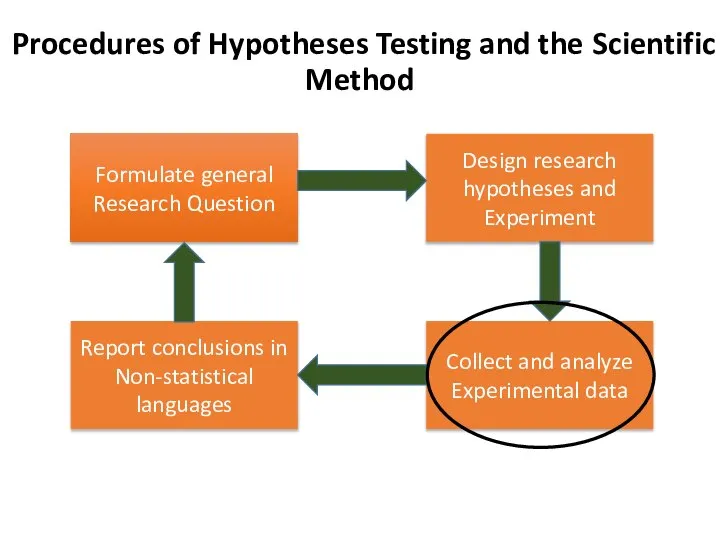
- 7. Formulate general Research Question Procedures of Hypotheses Testing and the Scientific Method Design research hypotheses and
- 8. I. Formulate general Research Question Does pregnancy have significant effect on mean Hb%?
- 9. I. Formulate general Research Question Does pregnancy have significant effect on mean Hb%?
- 10. Formulate general Research Question Procedures of Hypotheses Testing and the Scientific Method Design research hypotheses and
- 11. II. State Research Hypotheses Ho: µ = X (pregnancy has no significant effect on mean Hb%)
- 12. II. State Research Hypotheses Ho: µ = X (pregnancy has no significant effect on mean Hb%)
- 13. II. State Research Hypotheses Ho: µ = X (pregnancy has no significant effect on mean Hb%)
- 14. II. State Research Hypotheses Ho: µ = X (pregnancy has no significant effect on mean Hb%)
- 15. Design Research Hypotheses and Experiment
- 16. Formulate general Research Question Procedures of Hypotheses Testing and the Scientific Method Design research hypotheses and
- 17. V. Calculate test statistic VI. Make a Decision regarding Research Hypotheses (Specify the Decision Method) Reject
- 18. V. Calculate test statistic VI. Make a Decision regarding Research Hypotheses (Specify the Decision Method) Reject
- 19. V. Calculate test statistic VI. Make a Decision regarding Research Hypotheses (Specify the Decision Method) Reject
- 20. Collect and Analyze Experimental Data
- 22. Reject Ho Fail to Reject Ho Fail to Reject Ho Reject Ho +1.96 -1.96 µ 89%
- 23. Formulate general Research Question Procedures of Hypotheses Testing and the Scientific Method Design research hypotheses and
- 24. VII. Report a conclusion Pregnancy has a significant effect on mean Hb%. The mean Hb% of
- 25. VII. Report a conclusion Pregnancy has a significant effect on mean Hb%. The mean Hb% of
- 26. Comparing Means (Parametric tests) One Population Inference Two Population Inference Independent Sampling Model Dependent Sampling Model
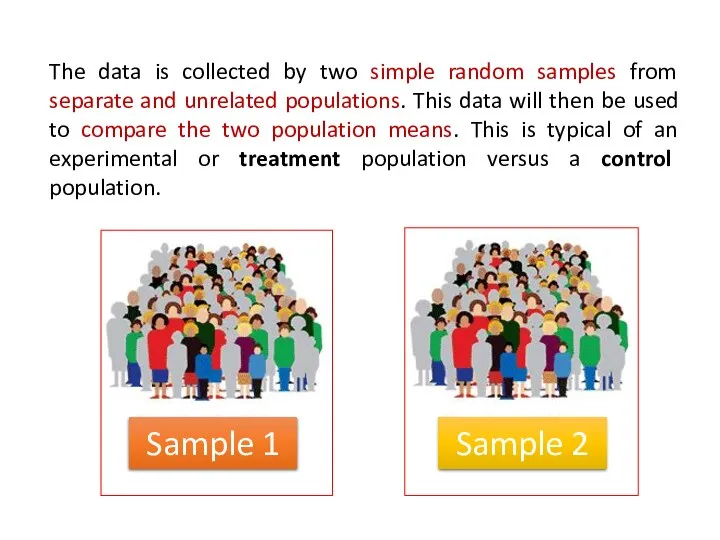
- 27. Sample 1 Sample 2 The data is collected by two simple random samples from separate and
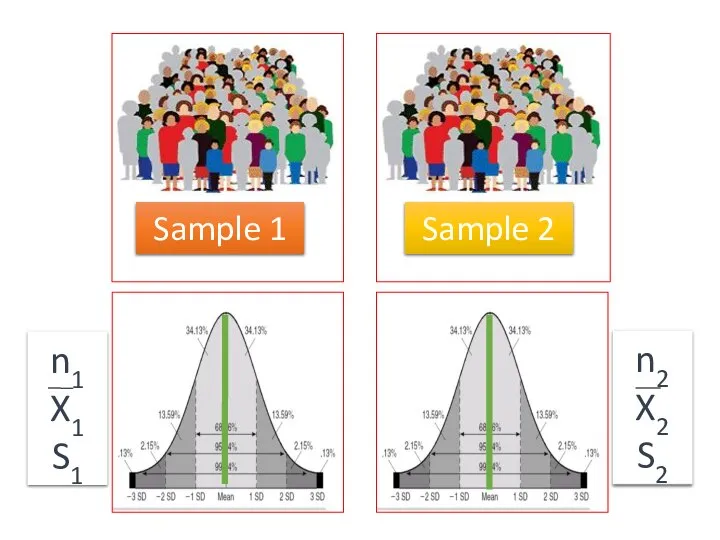
- 28. Sample 1 Sample 2 n1 X1 S1 n2 X2 S2
- 29. Exercise (14)
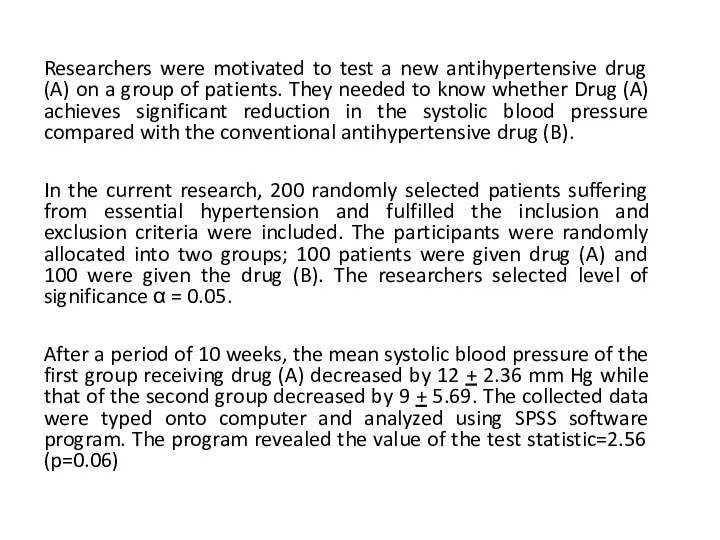
- 30. Researchers were motivated to test a new antihypertensive drug (A) on a group of patients. They
- 31. Formulate general Research Question Procedures of Hypotheses Testing and the Scientific Method Design research hypotheses and
- 32. I. Formulate general Research Question Does pregnancy have significant effect on mean Hb%?
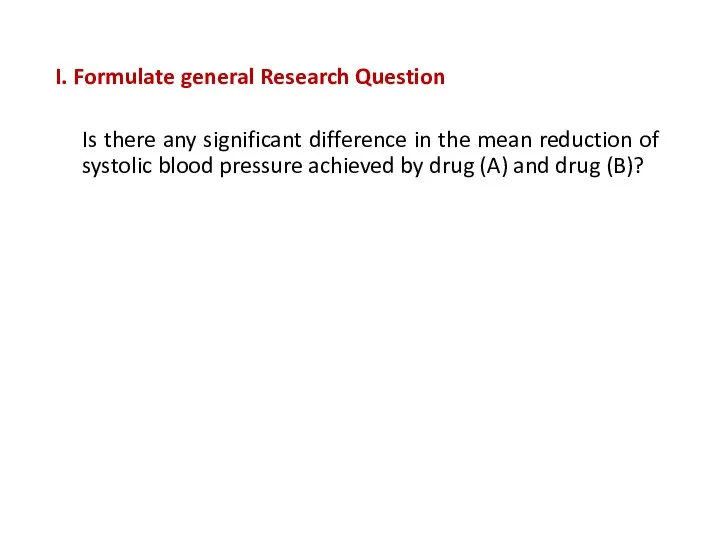
- 33. I. Formulate general Research Question Is there any significant difference in the mean reduction of systolic
- 34. Formulate general Research Question Procedures of Hypotheses Testing and the Scientific Method Design research hypotheses and
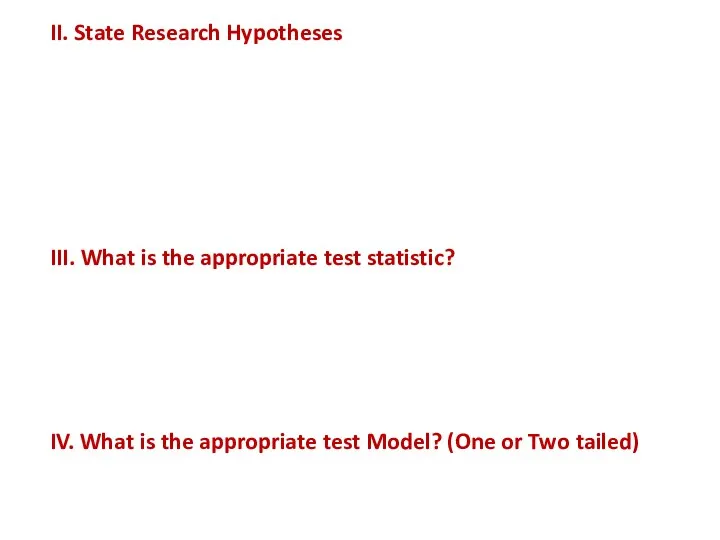
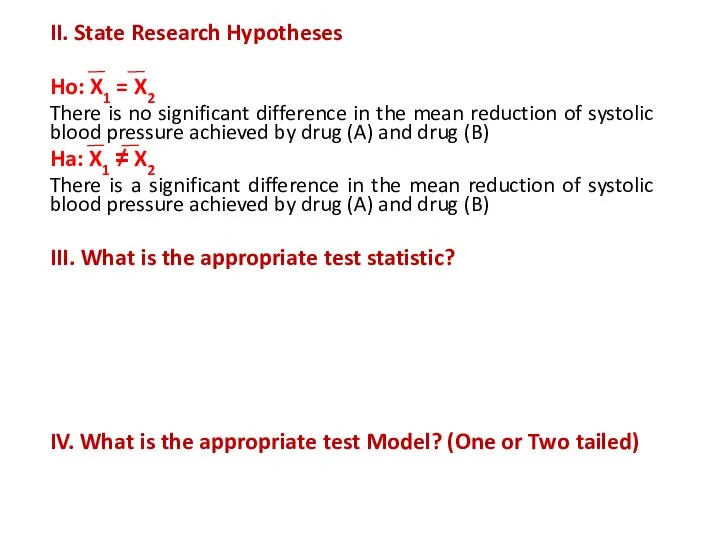
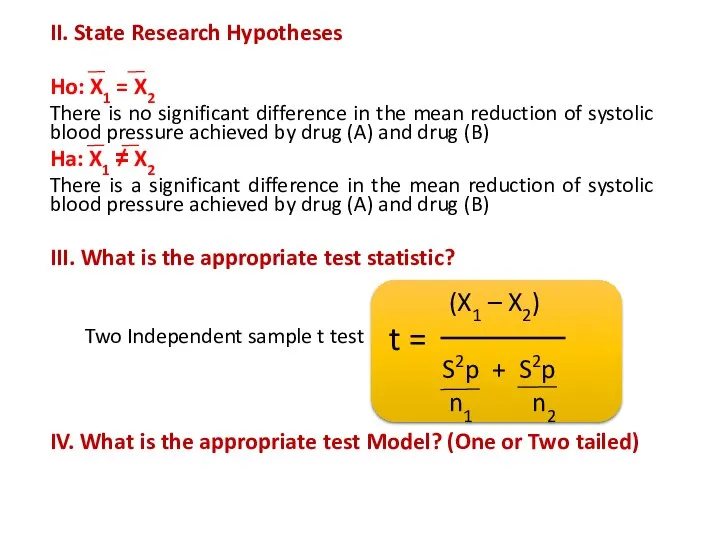
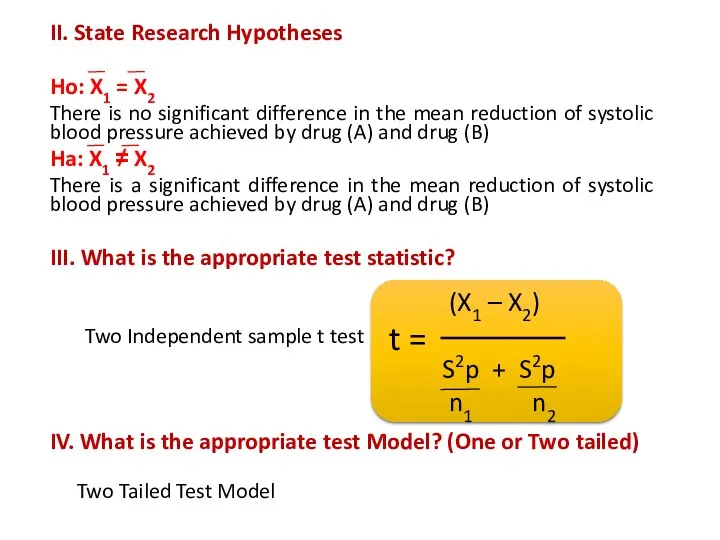
- 35. II. State Research Hypotheses Ho: X1 = X2 There is no significant difference in the mean
- 36. II. State Research Hypotheses Ho: X1 = X2 There is no significant difference in the mean
- 37. II. State Research Hypotheses Ho: X1 = X2 There is no significant difference in the mean
- 38. II. State Research Hypotheses Ho: X1 = X2 There is no significant difference in the mean
- 39. Design Research Hypotheses and Experiment
- 40. Formulate general Research Question Procedures of Hypotheses Testing and the Scientific Method Design research hypotheses and
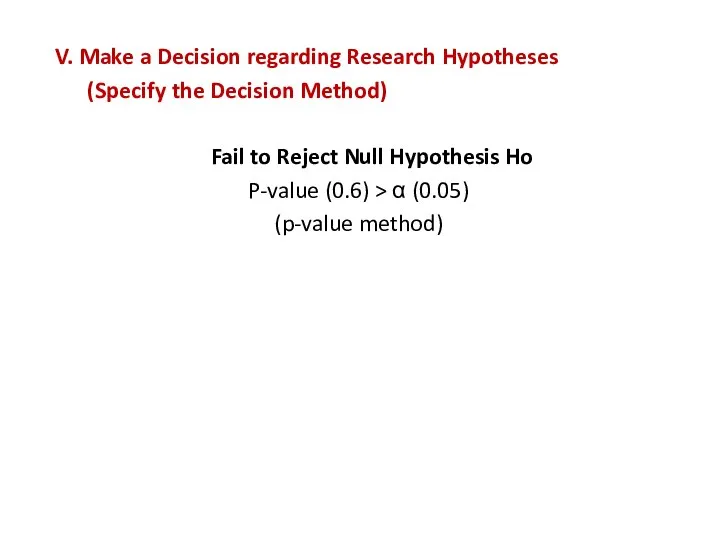
- 41. V. Make a Decision regarding Research Hypotheses (Specify the Decision Method) Fail to Reject Null Hypothesis
- 42. Collect and Analyze Experimental Data
- 43. Formulate general Research Question Procedures of Hypotheses Testing and the Scientific Method Design research hypotheses and
- 44. VI. Report a conclusion Pregnancy has a significant effect on mean Hb%. The mean Hb% of
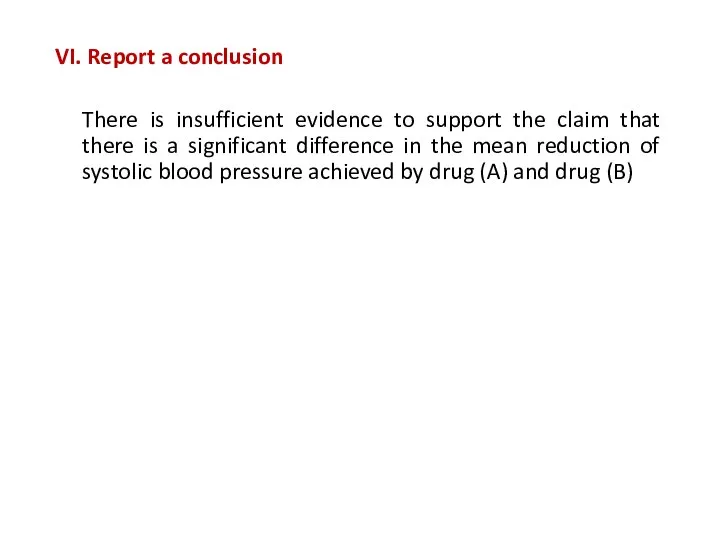
- 45. VI. Report a conclusion There is insufficient evidence to support the claim that there is a
- 46. Drug (A) Drug (B) n1 X1 S1 n2 X2 S2
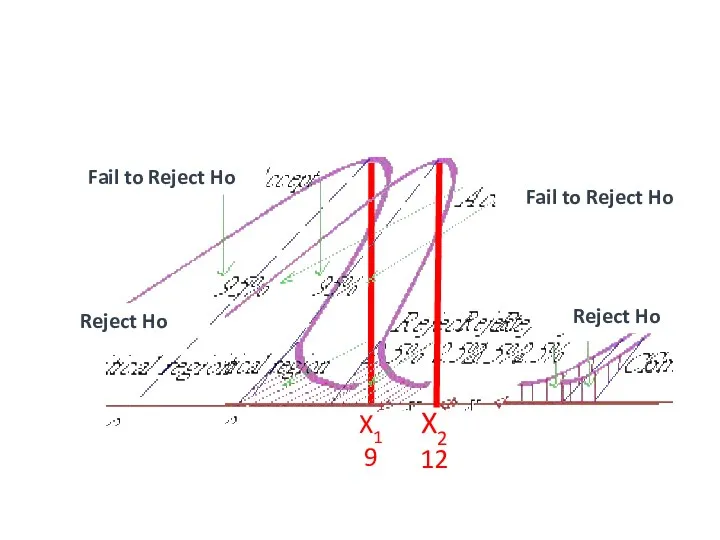
- 47. +1.96 -1.96 X1 9 X2 12 Fail to Reject Ho Reject Ho Reject Ho Fail to
- 48. Comparing Means (Parametric tests) One Population Inference Two Population Inference Independent Sampling Model Dependent Sampling Model
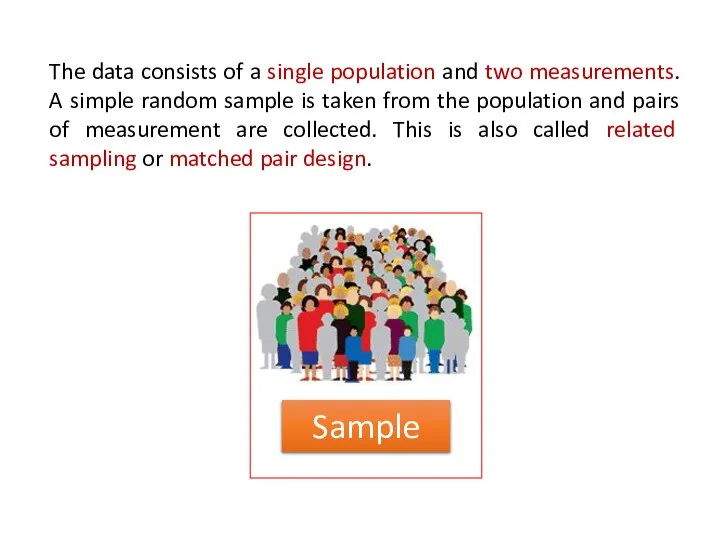
- 49. Sample The data consists of a single population and two measurements. A simple random sample is
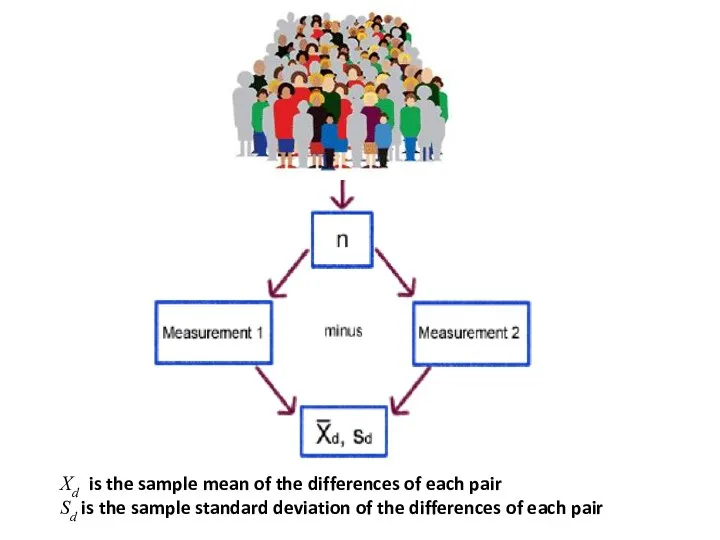
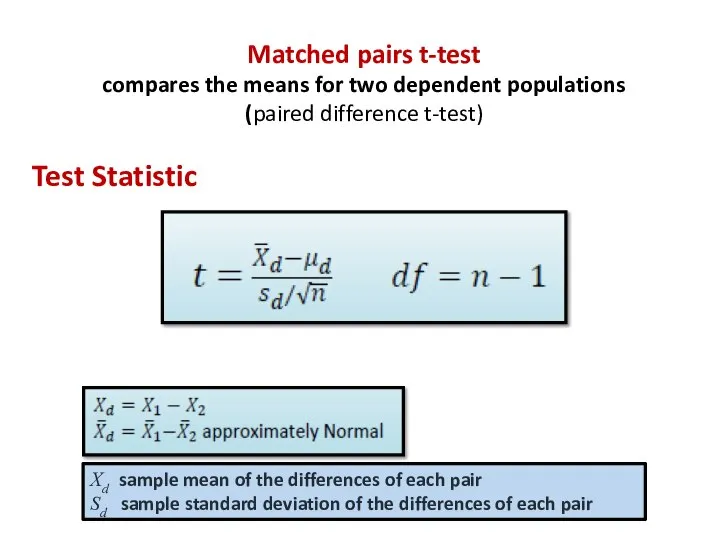
- 50. Xd is the sample mean of the differences of each pair Sd is the sample standard
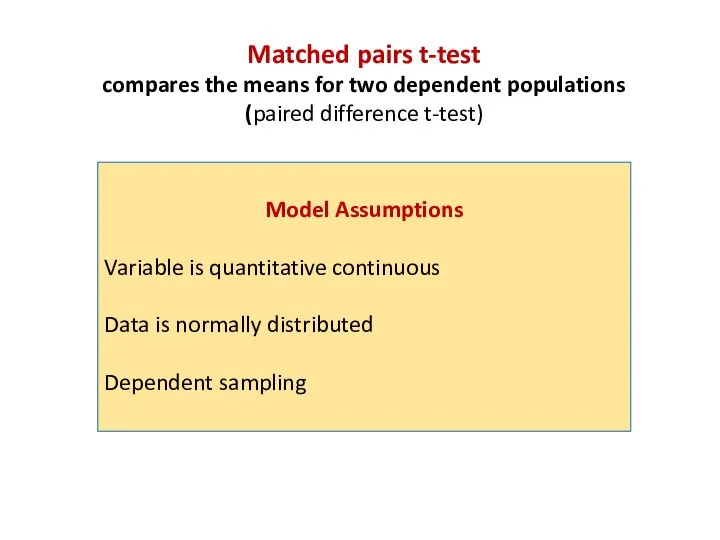
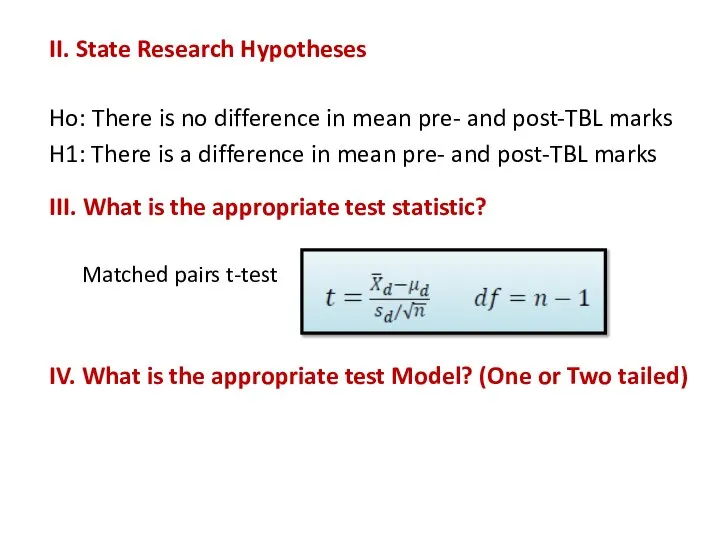
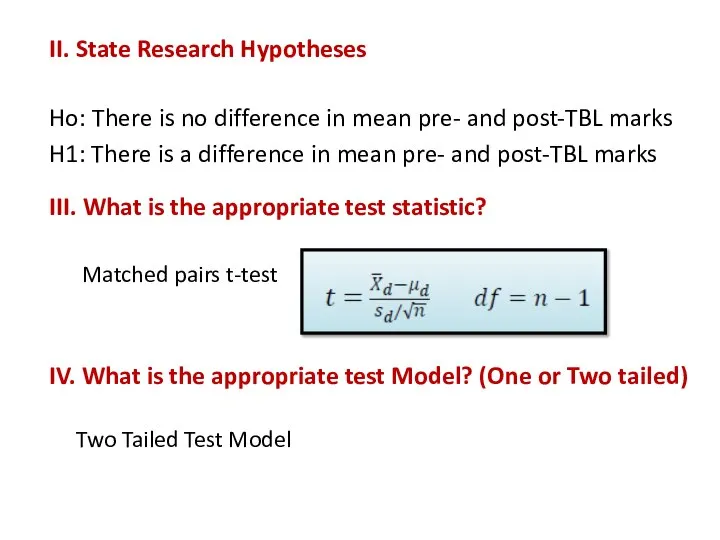
- 51. Matched pairs t-test compares the means for two dependent populations (paired difference t-test) Model Assumptions Variable
- 52. Matched pairs t-test compares the means for two dependent populations (paired difference t-test) Test Statistic Xd
- 53. Exercise (15)
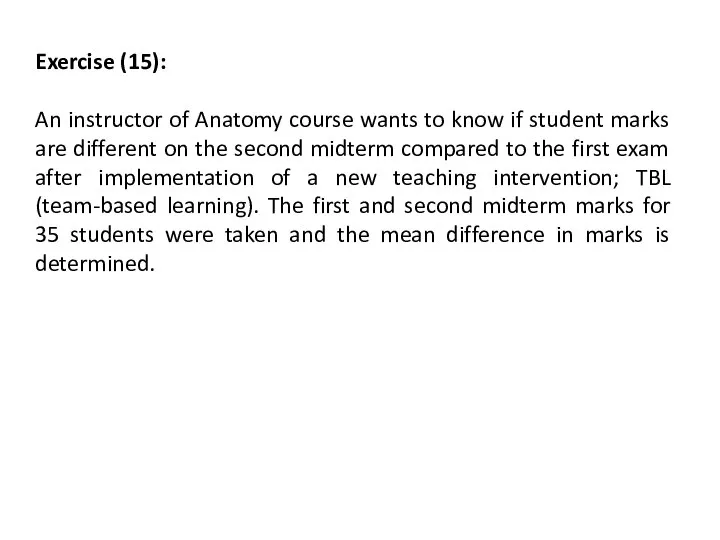
- 54. Exercise (15): An instructor of Anatomy course wants to know if student marks are different on
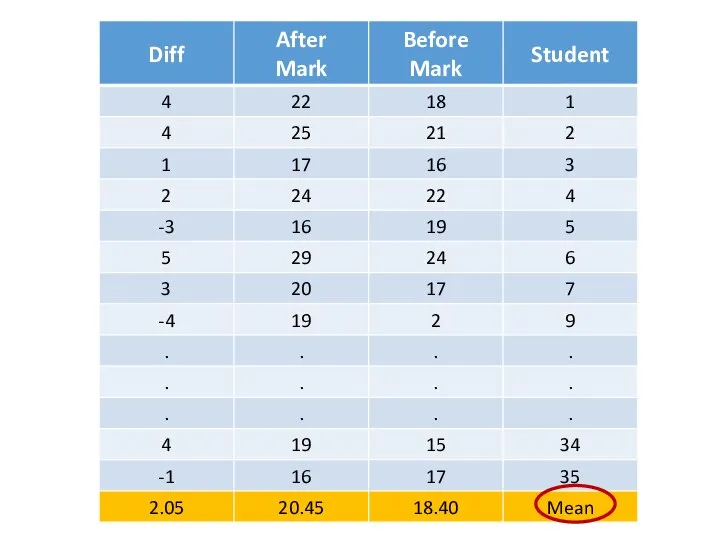
- 55. Xd is the sample mean of the differences of each pair (2.05) Sd is the sample
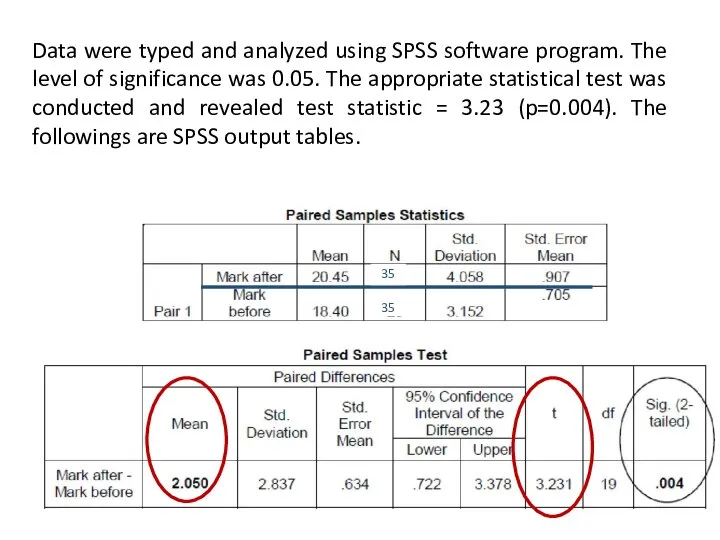
- 57. Data were typed and analyzed using SPSS software program. The level of significance was 0.05. The
- 58. Formulate general Research Question Procedures of Hypotheses Testing and the Scientific Method Design research hypotheses and
- 59. I. Formulate general Research Question Does pregnancy have significant effect on mean Hb%?
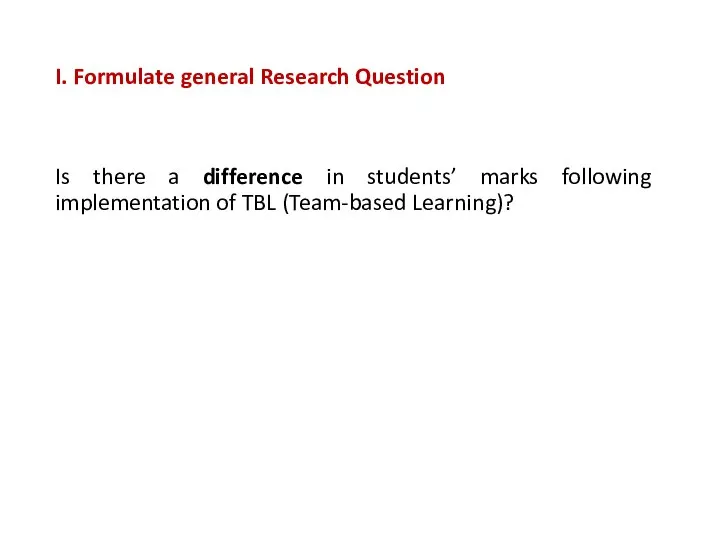
- 60. I. Formulate general Research Question Is there a difference in students’ marks following implementation of TBL
- 61. Formulate general Research Question Procedures of Hypotheses Testing and the Scientific Method Design research hypotheses and
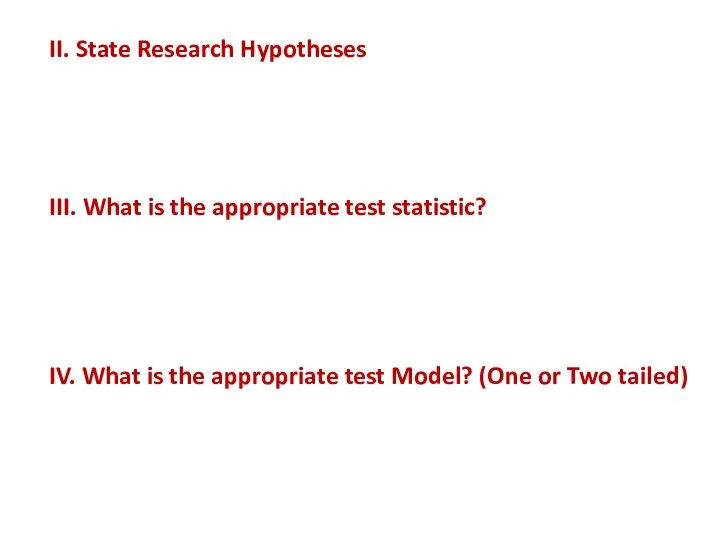
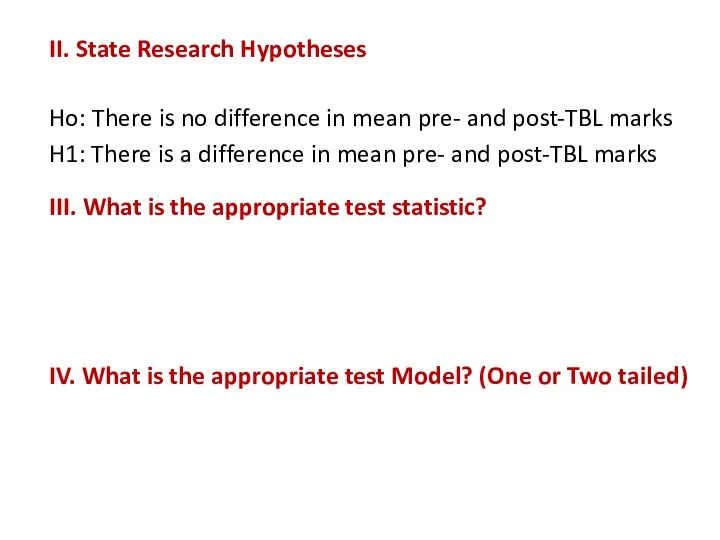
- 62. II. State Research Hypotheses Ho: There is no difference in mean pre- and post-TBL marks H1:
- 63. II. State Research Hypotheses Ho: There is no difference in mean pre- and post-TBL marks H1:
- 64. II. State Research Hypotheses Ho: There is no difference in mean pre- and post-TBL marks H1:
- 65. II. State Research Hypotheses Ho: There is no difference in mean pre- and post-TBL marks H1:
- 66. Design Research Hypotheses and Experiment
- 67. Formulate general Research Question Procedures of Hypotheses Testing and the Scientific Method Design research hypotheses and
- 68. Collect and Analyze Experimental Data
- 69. V. Make a Decision regarding Research Hypotheses (Specify the Decision Method) Reject Null Hypothesis Ho P-value
- 70. Data were typed and analyzed using SPSS software program. The level of significance was 0.05. The
- 71. V. Make a Decision regarding Research Hypotheses (Specify the Decision Method) Reject Null Hypothesis Ho P-value
- 72. Formulate general Research Question Procedures of Hypotheses Testing and the Scientific Method Design research hypotheses and
- 73. VI. Report a conclusion Pregnancy has a significant effect on mean Hb%. The mean Hb% of
- 74. VI. Report a conclusion There is a strong evidence (t = 3.23, p = 0.004) that
- 75. Xd is the sample mean of the differences of each pair (2.05) Sd is the sample
- 76. +1.96 -1.96 X1 18.40 X2 20.45 Fail to Reject Ho Reject Ho Reject Ho Fail to
- 77. Comparing Means (Parametric tests) One Population Inference Two Population Inference Independent Sampling Model Dependent Sampling Model
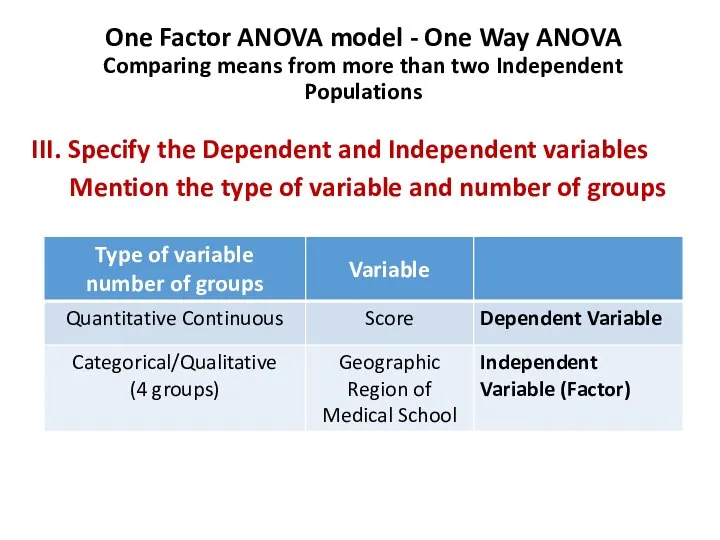
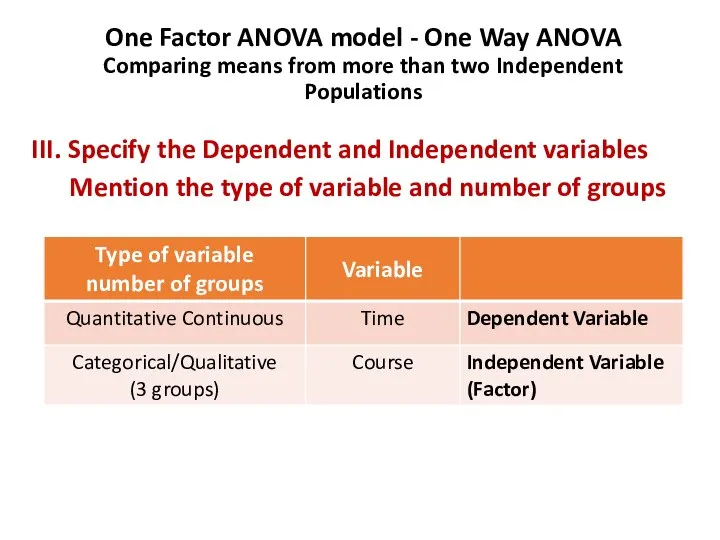
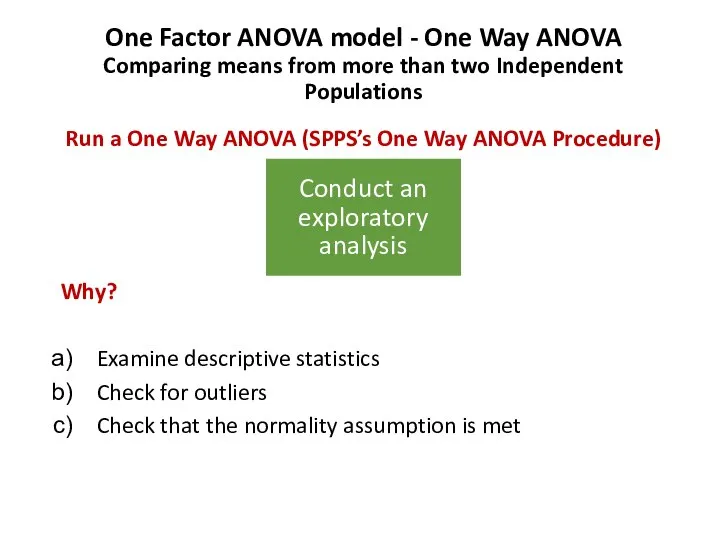
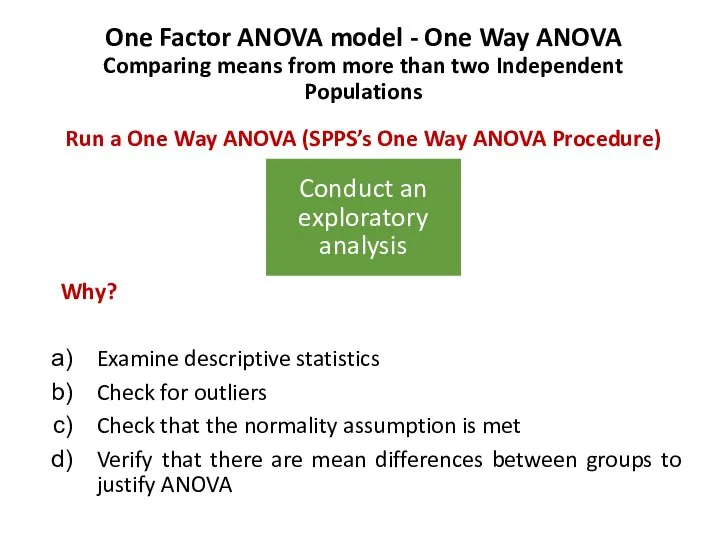
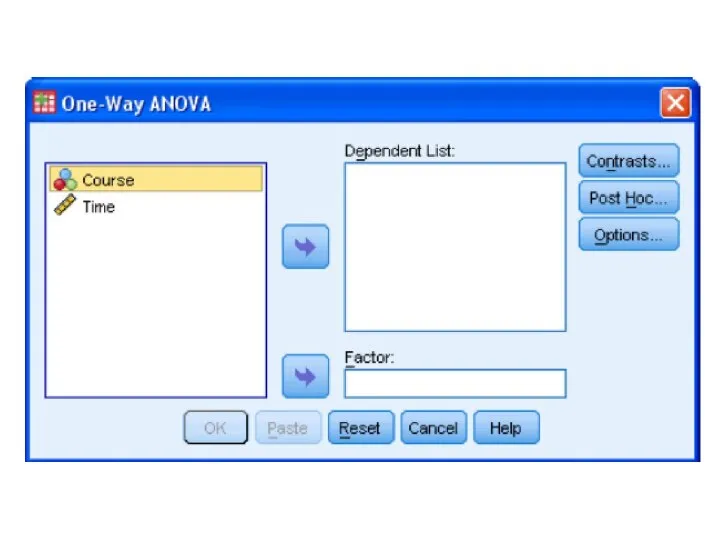
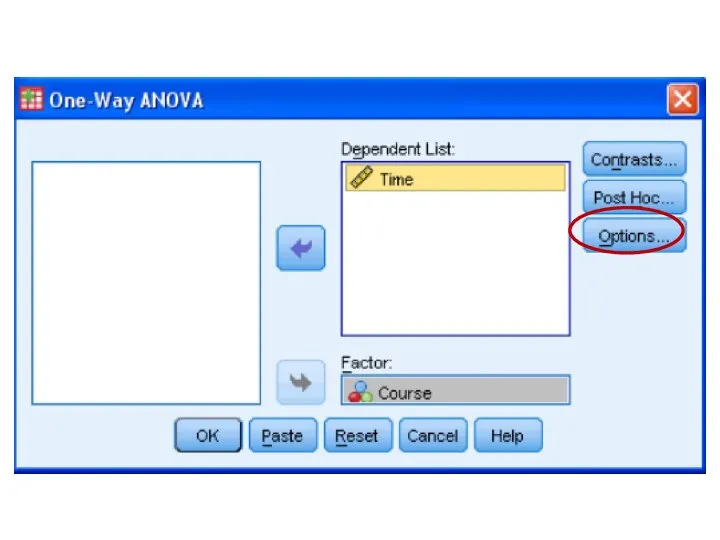
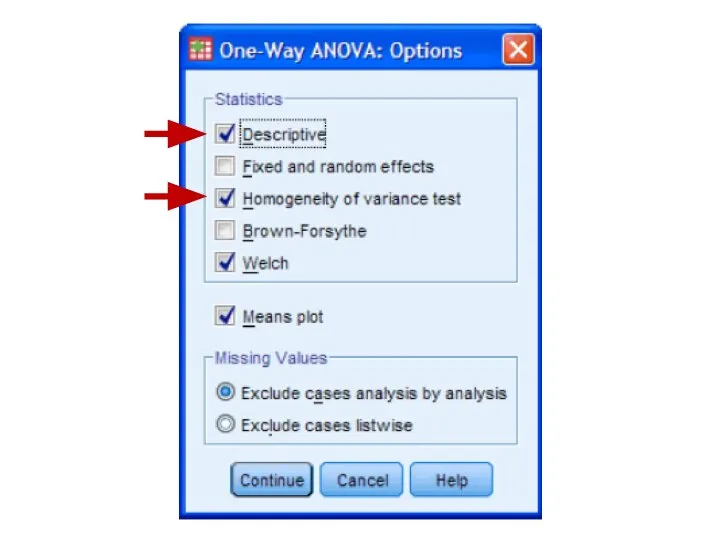
- 78. One Factor ANOVA model - One Way ANOVA Comparing means from more than two Independent Populations
- 79. One Factor ANOVA model - One Way ANOVA Comparing means from more than two Independent Populations
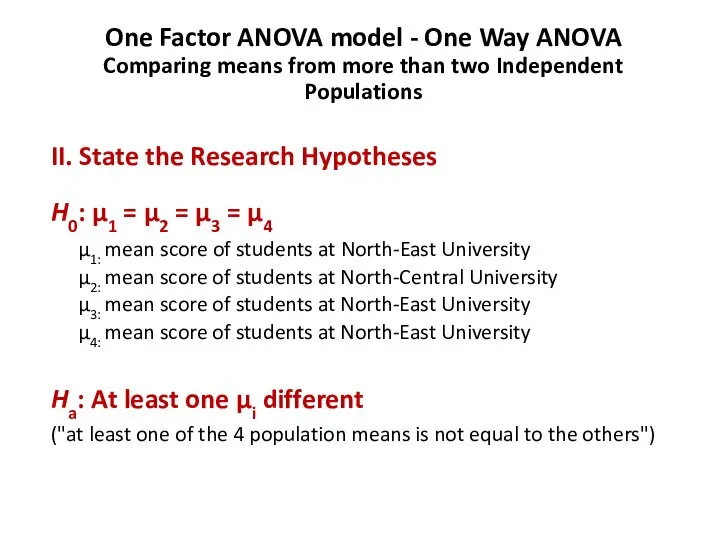
- 80. One Factor ANOVA model - One Way ANOVA Comparing means from more than two Independent Populations
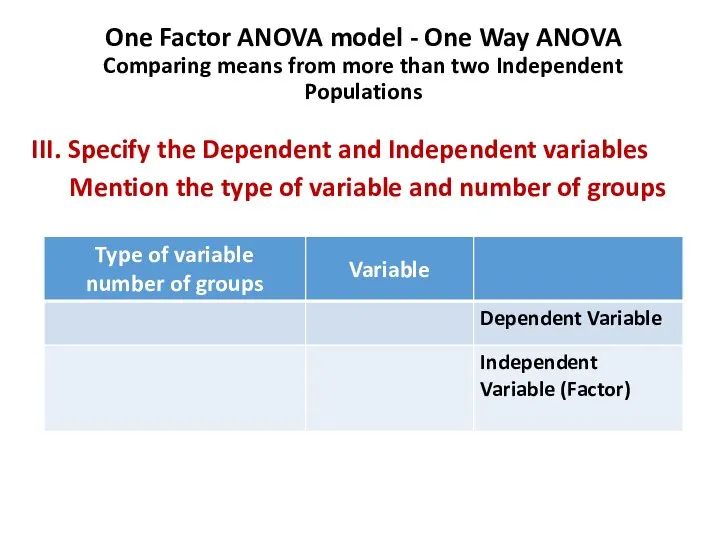
- 81. One Factor ANOVA model - One Way ANOVA Comparing means from more than two Independent Populations
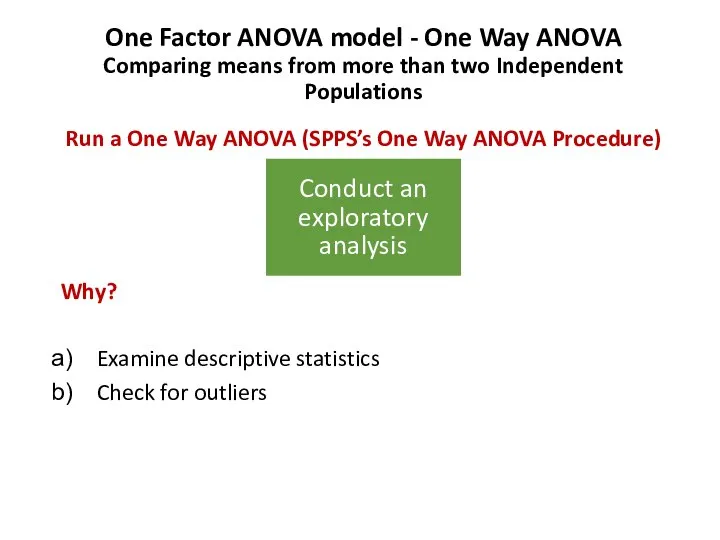
- 82. One Factor ANOVA model - One Way ANOVA Comparing means from more than two Independent Populations
- 83. One Factor ANOVA model - One Way ANOVA Comparing means from more than two Independent Populations
- 84. One Factor ANOVA model - One Way ANOVA Comparing means from more than two Independent Populations
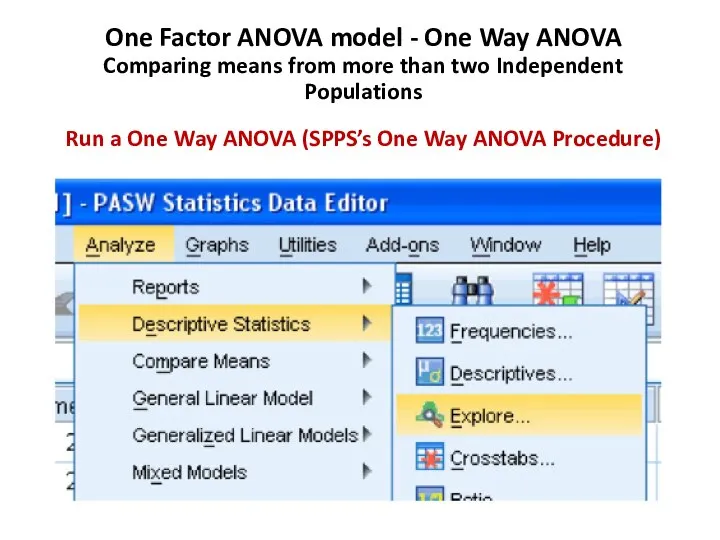
- 85. One Factor ANOVA model - One Way ANOVA Comparing means from more than two Independent Populations
- 86. One Factor ANOVA model - One Way ANOVA Comparing means from more than two Independent Populations
- 87. One Factor ANOVA model - One Way ANOVA Comparing means from more than two Independent Populations
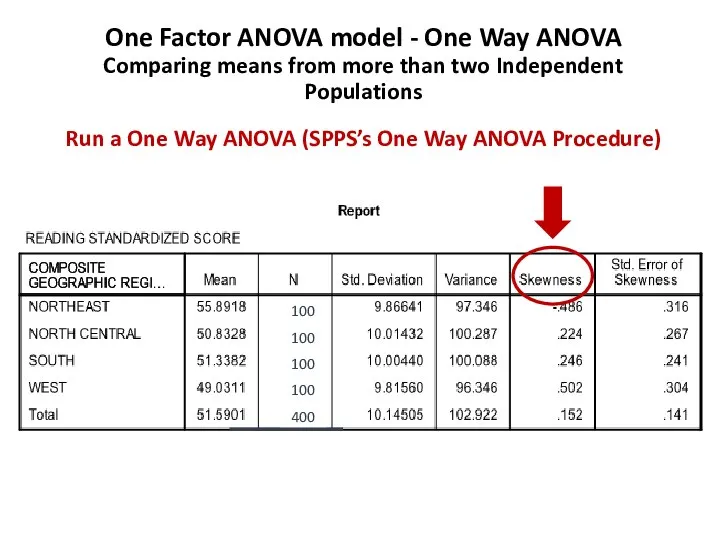
- 88. One Factor ANOVA model - One Way ANOVA Comparing means from more than two Independent Populations
- 89. One Factor ANOVA model - One Way ANOVA Comparing means from more than two Independent Populations
- 90. One Factor ANOVA model - One Way ANOVA Comparing means from more than two Independent Populations
- 91. One Factor ANOVA model - One Way ANOVA Comparing means from more than two Independent Populations
- 92. One Factor ANOVA model - One Way ANOVA Comparing means from more than two Independent Populations
- 93. Exercise (16)
- 94. One Factor ANOVA model - One Way ANOVA Comparing means from more than two Independent Populations
- 95. One Factor ANOVA model - One Way ANOVA Comparing means from more than two Independent Populations
- 96. One Factor ANOVA model - One Way ANOVA Comparing means from more than two Independent Populations
- 97. One Factor ANOVA model - One Way ANOVA Comparing means from more than two Independent Populations
- 98. One Factor ANOVA model - One Way ANOVA Comparing means from more than two Independent Populations
- 99. One Factor ANOVA model - One Way ANOVA Comparing means from more than two Independent Populations
- 100. One Factor ANOVA model - One Way ANOVA Comparing means from more than two Independent Populations
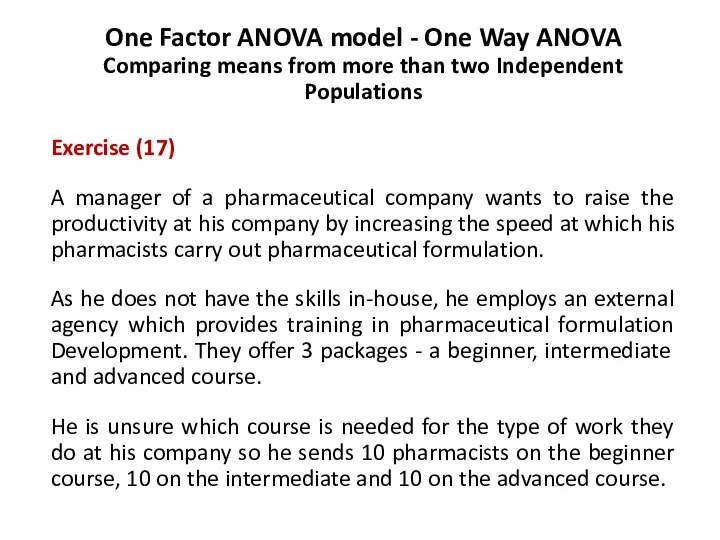
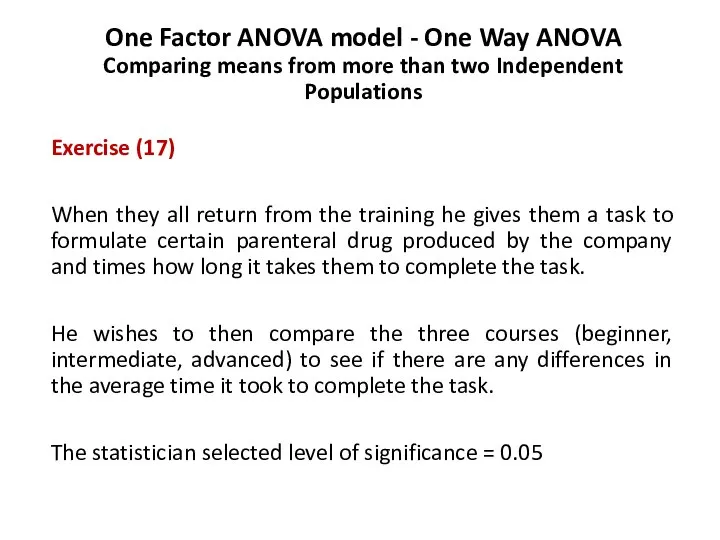
- 101. Exercise (17)
- 102. One Factor ANOVA model - One Way ANOVA Comparing means from more than two Independent Populations
- 103. One Factor ANOVA model - One Way ANOVA Comparing means from more than two Independent Populations
- 104. One Factor ANOVA model - One Way ANOVA Comparing means from more than two Independent Populations
- 105. One Factor ANOVA model - One Way ANOVA Comparing means from more than two Independent Populations
- 106. One Factor ANOVA model - One Way ANOVA Comparing means from more than two Independent Populations
- 107. One Factor ANOVA model - One Way ANOVA Comparing means from more than two Independent Populations
- 108. One Factor ANOVA model - One Way ANOVA Comparing means from more than two Independent Populations
- 109. One Factor ANOVA model - One Way ANOVA Comparing means from more than two Independent Populations
- 110. One Factor ANOVA model - One Way ANOVA Comparing means from more than two Independent Populations
- 111. One Factor ANOVA model - One Way ANOVA Comparing means from more than two Independent Populations
- 112. One Factor ANOVA model - One Way ANOVA Comparing means from more than two Independent Populations
- 113. One Factor ANOVA model - One Way ANOVA Comparing means from more than two Independent Populations
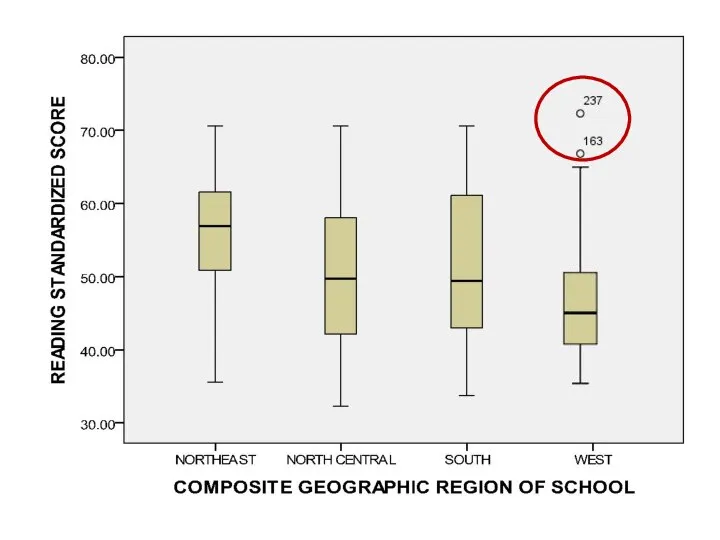
- 114. Box plot graph
- 116. One Factor ANOVA model - One Way ANOVA Comparing means from more than two Independent Populations
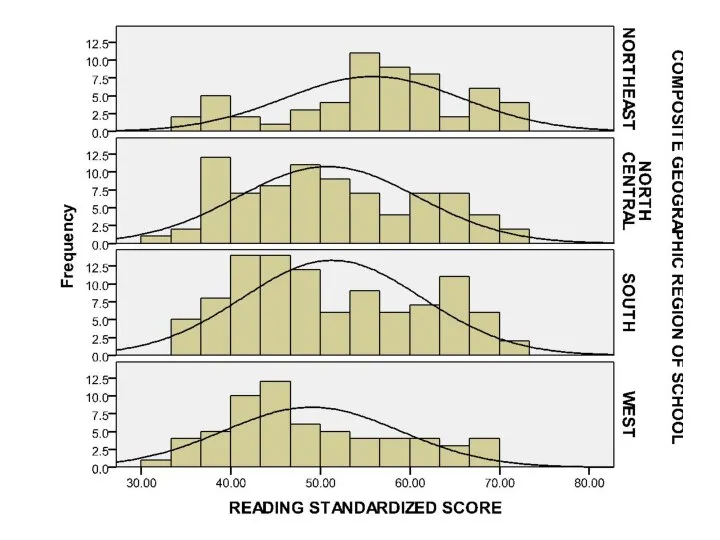
- 117. Histogram
- 119. Tests of Normality
- 120. One Factor ANOVA model - One Way ANOVA Comparing means from more than two Independent Populations
- 122. One Factor ANOVA model - One Way ANOVA Comparing means from more than two Independent Populations
- 123. One Factor ANOVA model - One Way ANOVA Comparing means from more than two Independent Populations
- 124. Error Bar graph
- 126. One Factor ANOVA model - One Way ANOVA Comparing means from more than two Independent Populations
- 127. One Factor ANOVA model - One Way ANOVA Comparing means from more than two Independent Populations
- 128. One Factor ANOVA model - One Way ANOVA Comparing means from more than two Independent Populations
- 136. One Factor ANOVA model - One Way ANOVA Comparing means from more than two Independent Populations
- 137. One Factor ANOVA model - One Way ANOVA Comparing means from more than two Independent Populations
- 138. One Factor ANOVA model - One Way ANOVA Comparing means from more than two Independent Populations
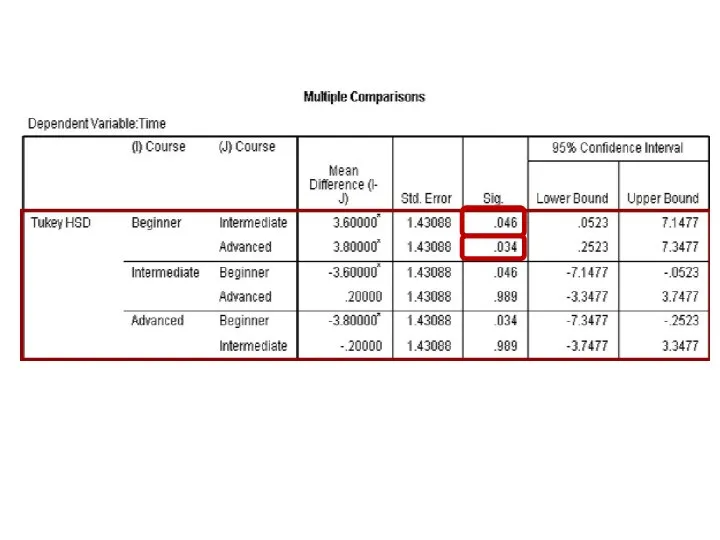
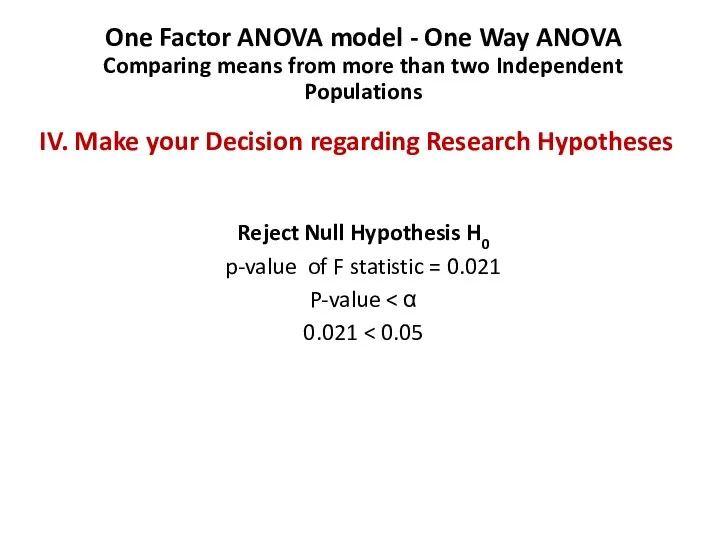
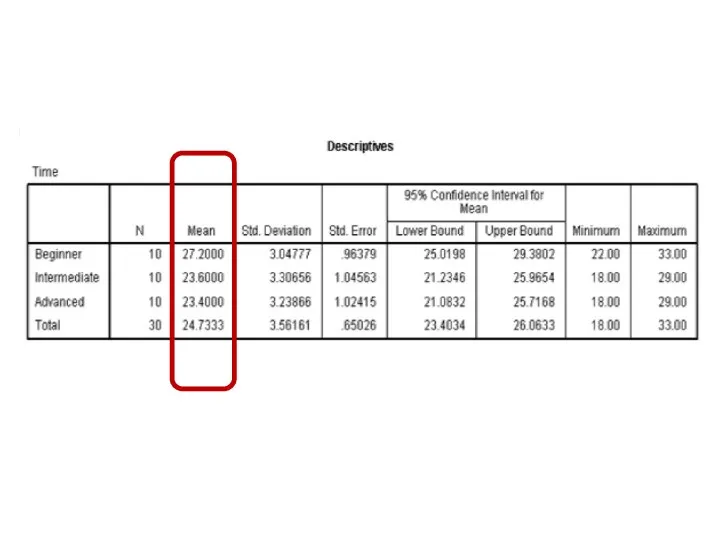
- 144. One Factor ANOVA model - One Way ANOVA Comparing means from more than two Independent Populations
- 145. One Factor ANOVA model - One Way ANOVA Comparing means from more than two Independent Populations
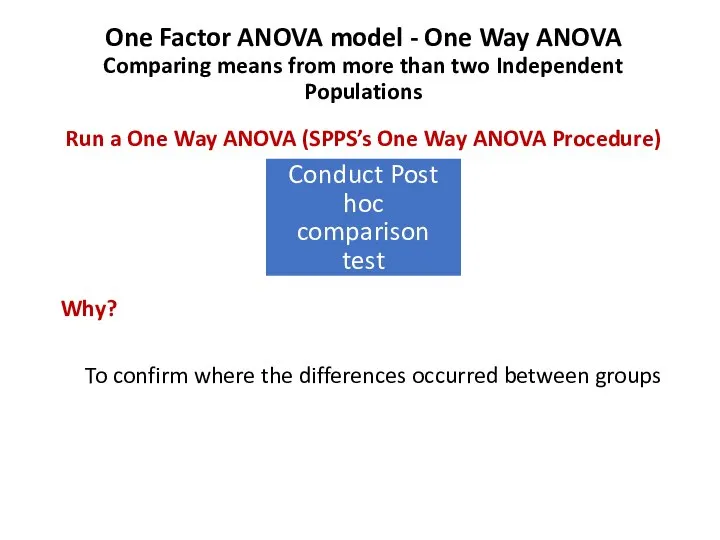
- 146. Return to Exercise (16)
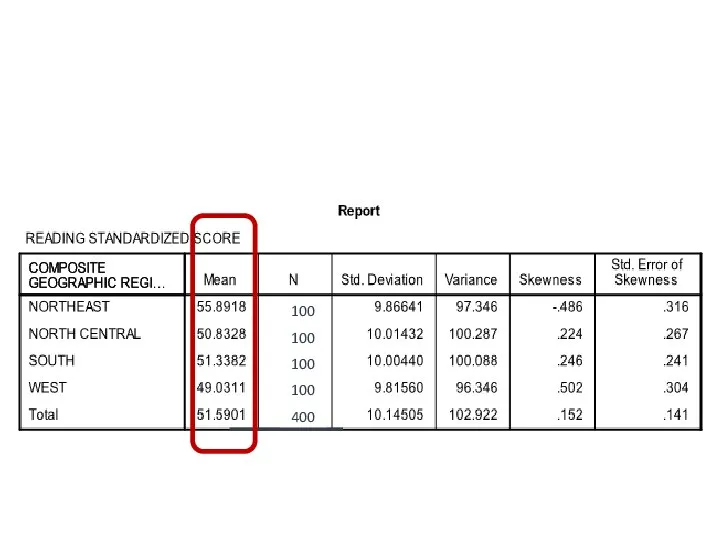
- 149. 100 100 100 100 400
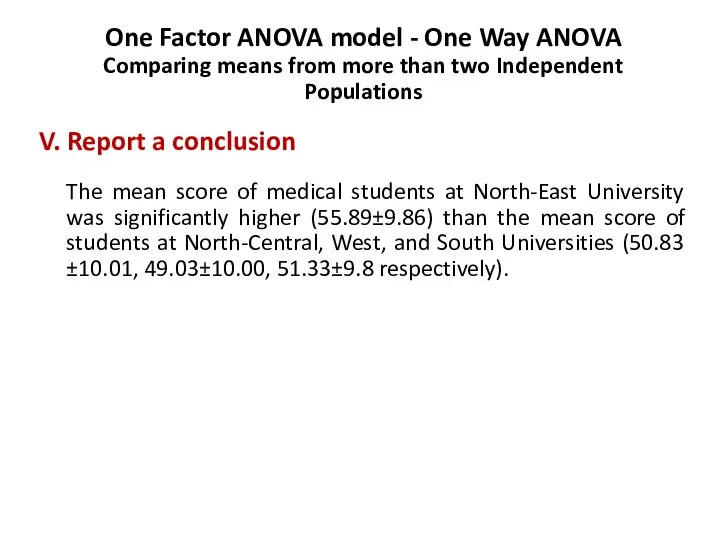
- 150. One Factor ANOVA model - One Way ANOVA Comparing means from more than two Independent Populations
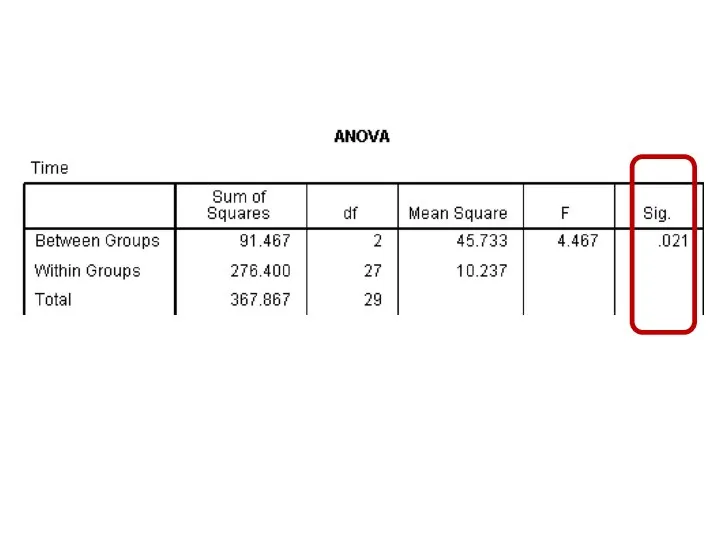
- 152. One Factor ANOVA model - One Way ANOVA Comparing means from more than two Independent Populations
- 153. One Factor ANOVA model - One Way ANOVA Comparing means from more than two Independent Populations
- 155. 100 100 100 100 400
- 156. One Factor ANOVA model - One Way ANOVA Comparing means from more than two Independent Populations
- 157. Return to Exercise (17)
- 161. One Factor ANOVA model - One Way ANOVA Comparing means from more than two Independent Populations
- 163. One Factor ANOVA model - One Way ANOVA Comparing means from more than two Independent Populations
- 164. One Factor ANOVA model - One Way ANOVA Comparing means from more than two Independent Populations
- 167. One Factor ANOVA model - One Way ANOVA Comparing means from more than two Independent Populations
- 168. One Factor ANOVA model - One Way ANOVA Comparing means from more than two Independent Populations
- 169. Comparing Means (Parametric tests) One Population Inference Two Population Inference Independent Sampling Model Dependent Sampling Model
- 172. Скачать презентацию
Слайд 5Exercise (13)
Exercise (13)
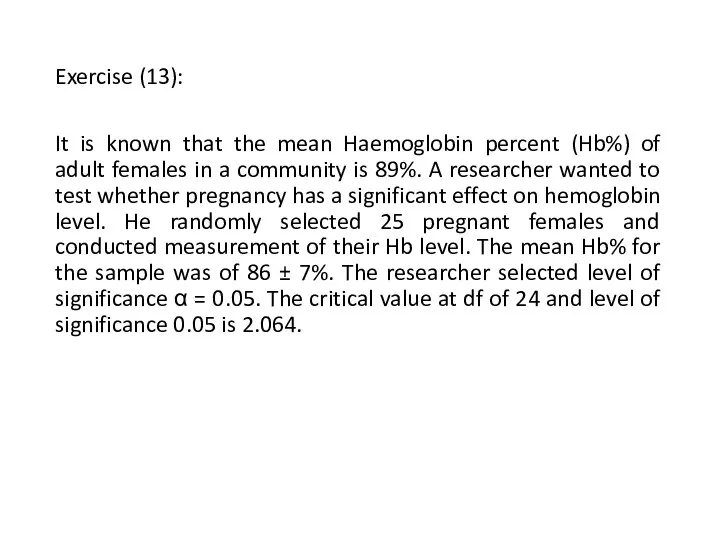
Слайд 6Exercise (13):
It is known that the mean Haemoglobin percent (Hb%) of adult
Exercise (13):
It is known that the mean Haemoglobin percent (Hb%) of adult
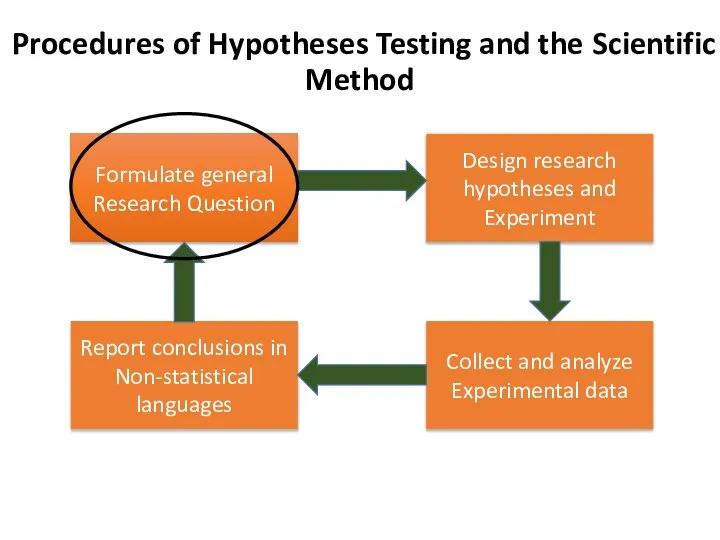
Слайд 7Formulate general Research Question
Procedures of Hypotheses Testing and the Scientific Method
Design
Formulate general Research Question
Procedures of Hypotheses Testing and the Scientific Method
Design
Слайд 8I. Formulate general Research Question
Does pregnancy have significant effect on mean Hb%?
I. Formulate general Research Question
Does pregnancy have significant effect on mean Hb%?
Слайд 9I. Formulate general Research Question
Does pregnancy have significant effect on mean Hb%?
I. Formulate general Research Question
Does pregnancy have significant effect on mean Hb%?
Слайд 10Formulate general Research Question
Procedures of Hypotheses Testing and the Scientific Method
Design
Formulate general Research Question
Procedures of Hypotheses Testing and the Scientific Method
Design
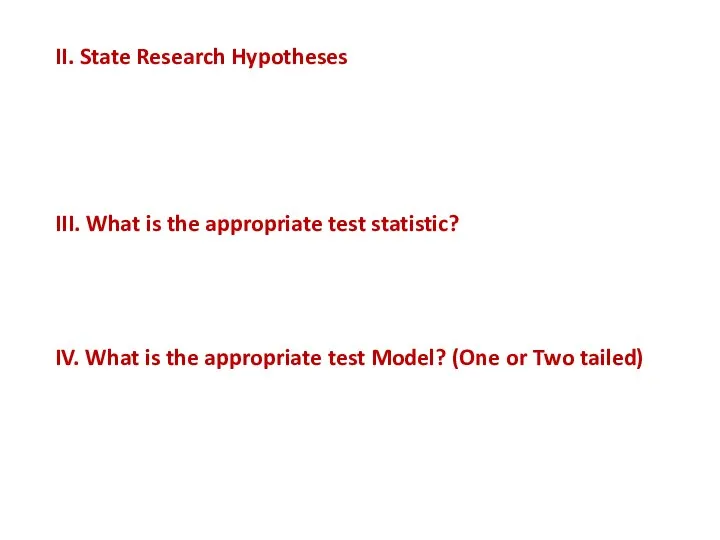
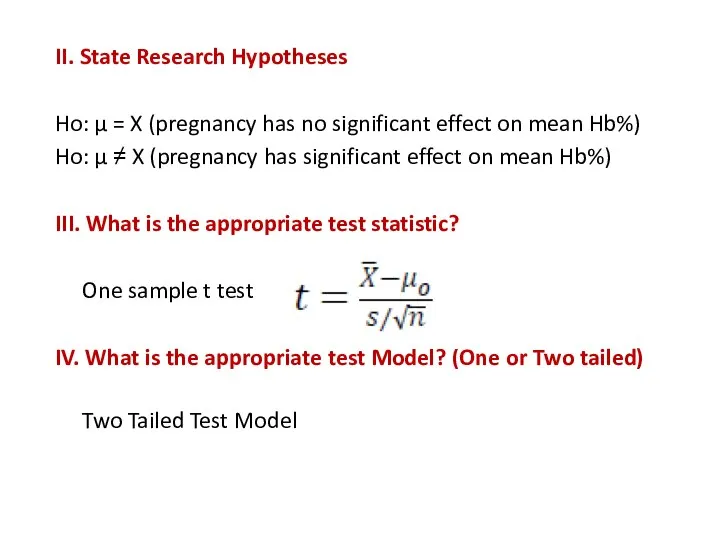
Слайд 11II. State Research Hypotheses
Ho: µ = X (pregnancy has no significant effect
II. State Research Hypotheses
Ho: µ = X (pregnancy has no significant effect
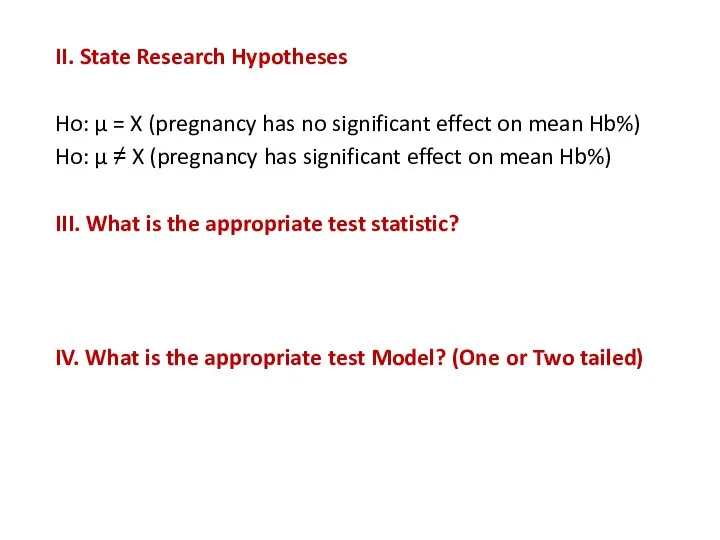
Слайд 12II. State Research Hypotheses
Ho: µ = X (pregnancy has no significant effect
II. State Research Hypotheses
Ho: µ = X (pregnancy has no significant effect
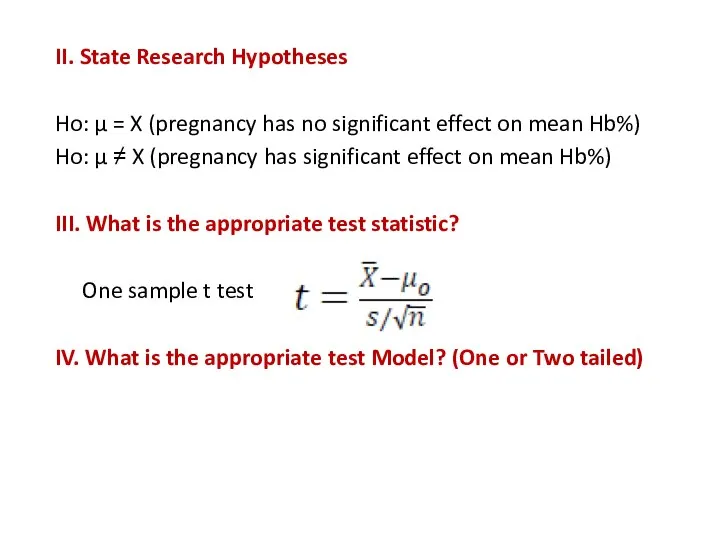
Слайд 13II. State Research Hypotheses
Ho: µ = X (pregnancy has no significant effect
II. State Research Hypotheses
Ho: µ = X (pregnancy has no significant effect
Слайд 14II. State Research Hypotheses
Ho: µ = X (pregnancy has no significant effect
II. State Research Hypotheses
Ho: µ = X (pregnancy has no significant effect
Слайд 15Design Research Hypotheses and Experiment
Design Research Hypotheses and Experiment

Слайд 16Formulate general Research Question
Procedures of Hypotheses Testing and the Scientific Method
Design
Formulate general Research Question
Procedures of Hypotheses Testing and the Scientific Method
Design

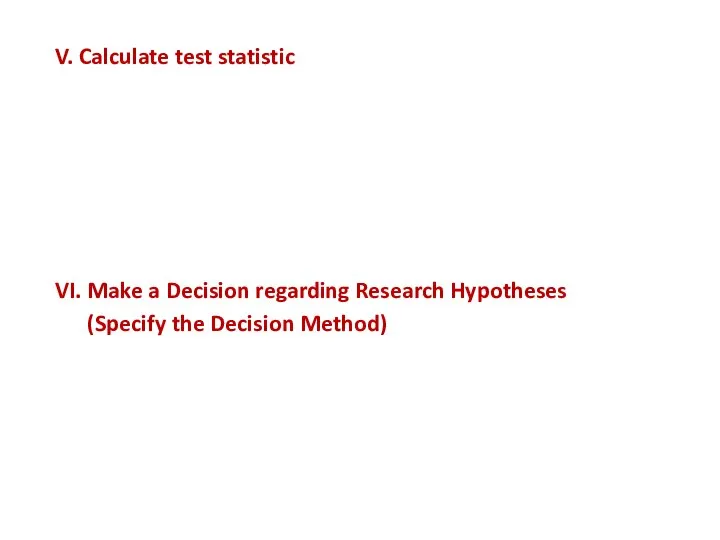
Слайд 17V. Calculate test statistic
VI. Make a Decision regarding Research Hypotheses
(Specify the
V. Calculate test statistic
VI. Make a Decision regarding Research Hypotheses
(Specify the
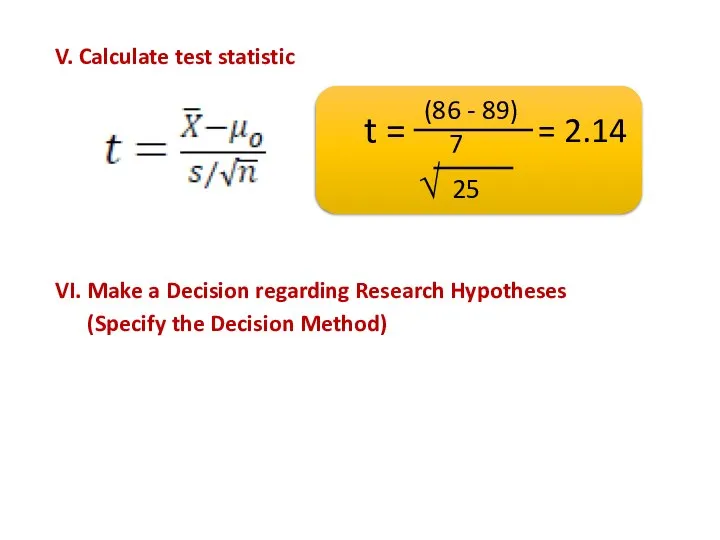
Слайд 18V. Calculate test statistic
VI. Make a Decision regarding Research Hypotheses
(Specify the
V. Calculate test statistic
VI. Make a Decision regarding Research Hypotheses
(Specify the
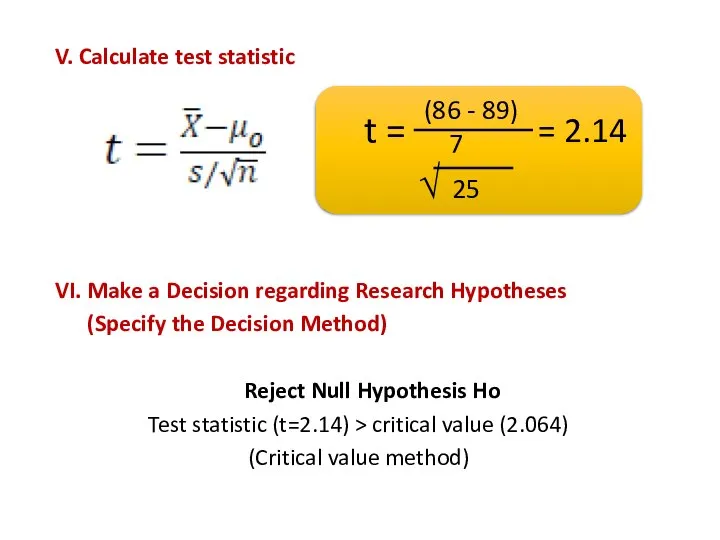
Слайд 19V. Calculate test statistic
VI. Make a Decision regarding Research Hypotheses
(Specify the
V. Calculate test statistic
VI. Make a Decision regarding Research Hypotheses
(Specify the
Слайд 20Collect and Analyze Experimental Data
Collect and Analyze Experimental Data


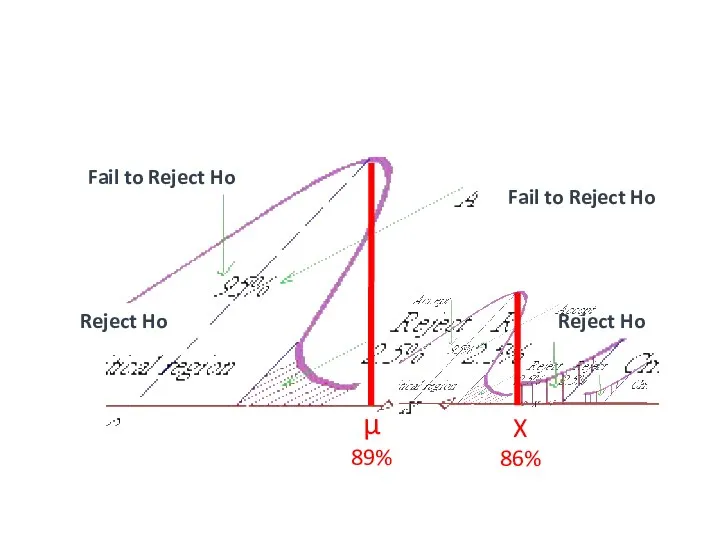
Слайд 22Reject Ho
Fail to Reject Ho
Fail to Reject Ho
Reject Ho
+1.96
-1.96
µ
89%
X
86%
Reject Ho
Fail to Reject Ho
Fail to Reject Ho
Reject Ho
+1.96
-1.96
µ
89%
X
86%
Слайд 23Formulate general Research Question
Procedures of Hypotheses Testing and the Scientific Method
Design
Formulate general Research Question
Procedures of Hypotheses Testing and the Scientific Method
Design
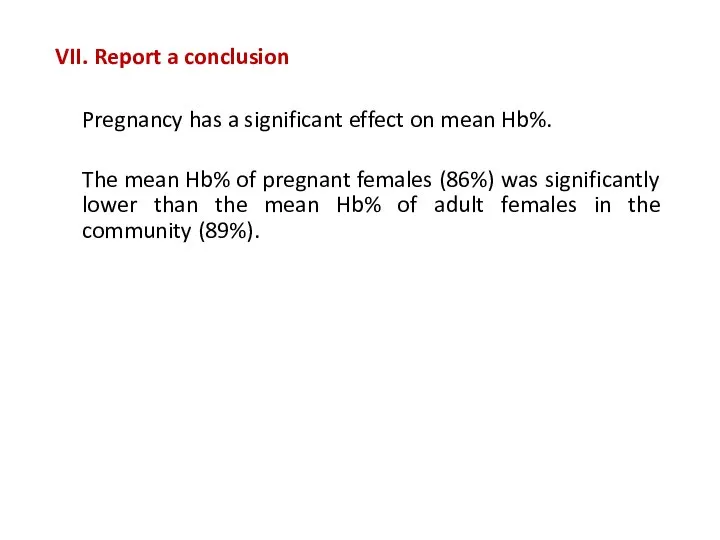
Слайд 24VII. Report a conclusion
Pregnancy has a significant effect on mean Hb%.
The mean
VII. Report a conclusion
Pregnancy has a significant effect on mean Hb%.
The mean

Слайд 25VII. Report a conclusion
Pregnancy has a significant effect on mean Hb%.
The mean
VII. Report a conclusion
Pregnancy has a significant effect on mean Hb%.
The mean
Слайд 26Comparing Means
(Parametric tests)
One Population Inference
Two Population Inference
Independent Sampling Model
Dependent Sampling Model
Analysis
Comparing Means
(Parametric tests)
One Population Inference
Two Population Inference
Independent Sampling Model
Dependent Sampling Model
Analysis
Слайд 27Sample 1
Sample 2
The data is collected by two simple random samples
Sample 1
Sample 2
The data is collected by two simple random samples
Слайд 28Sample 1
Sample 2
n1
X1
S1
n2
X2
S2
Sample 1
Sample 2
n1
X1
S1
n2
X2
S2
Слайд 29Exercise (14)
Exercise (14)

Слайд 30Researchers were motivated to test a new antihypertensive drug (A) on a
Слайд 31Formulate general Research Question
Procedures of Hypotheses Testing and the Scientific Method
Design
Formulate general Research Question
Procedures of Hypotheses Testing and the Scientific Method
Design

Слайд 32I. Formulate general Research Question
Does pregnancy have significant effect on mean Hb%?
I. Formulate general Research Question
Does pregnancy have significant effect on mean Hb%?

Слайд 33I. Formulate general Research Question
Is there any significant difference in the mean
I. Formulate general Research Question
Is there any significant difference in the mean
Слайд 34Formulate general Research Question
Procedures of Hypotheses Testing and the Scientific Method
Design
Formulate general Research Question
Procedures of Hypotheses Testing and the Scientific Method
Design

Слайд 35II. State Research Hypotheses
Ho: X1 = X2
There is no significant difference
II. State Research Hypotheses
Ho: X1 = X2
There is no significant difference
Слайд 36II. State Research Hypotheses
Ho: X1 = X2
There is no significant difference
II. State Research Hypotheses
Ho: X1 = X2
There is no significant difference
Слайд 37II. State Research Hypotheses
Ho: X1 = X2
There is no significant difference
II. State Research Hypotheses
Ho: X1 = X2
There is no significant difference
Слайд 38II. State Research Hypotheses
Ho: X1 = X2
There is no significant difference
II. State Research Hypotheses
Ho: X1 = X2
There is no significant difference
Слайд 39Design Research Hypotheses and Experiment
Design Research Hypotheses and Experiment
Слайд 40Formulate general Research Question
Procedures of Hypotheses Testing and the Scientific Method
Design
Formulate general Research Question
Procedures of Hypotheses Testing and the Scientific Method
Design

Слайд 41V. Make a Decision regarding Research Hypotheses
(Specify the Decision Method)
Fail
V. Make a Decision regarding Research Hypotheses
(Specify the Decision Method)
Fail
Слайд 42Collect and Analyze Experimental Data
Collect and Analyze Experimental Data

Слайд 43Formulate general Research Question
Procedures of Hypotheses Testing and the Scientific Method
Design
Formulate general Research Question
Procedures of Hypotheses Testing and the Scientific Method
Design

Слайд 44VI. Report a conclusion
Pregnancy has a significant effect on mean Hb%.
The mean
VI. Report a conclusion
Pregnancy has a significant effect on mean Hb%.
The mean

Слайд 45VI. Report a conclusion
There is insufficient evidence to support the claim that
VI. Report a conclusion
There is insufficient evidence to support the claim that
Слайд 46Drug (A)
Drug (B)
n1
X1
S1
n2
X2
S2
Drug (A)
Drug (B)
n1
X1
S1
n2
X2
S2

Слайд 47+1.96
-1.96
X1
9
X2
12
Fail to Reject Ho
Reject Ho
Reject Ho
Fail to Reject Ho
+1.96
-1.96
X1
9
X2
12
Fail to Reject Ho
Reject Ho
Reject Ho
Fail to Reject Ho
Слайд 48Comparing Means
(Parametric tests)
One Population Inference
Two Population Inference
Independent Sampling Model
Dependent Sampling Model
Analysis
Comparing Means
(Parametric tests)
One Population Inference
Two Population Inference
Independent Sampling Model
Dependent Sampling Model
Analysis
Слайд 49Sample
The data consists of a single population and two measurements. A
Sample
The data consists of a single population and two measurements. A
Слайд 50Xd is the sample mean of the differences of each pair
Sd is
Xd is the sample mean of the differences of each pair
Sd is
Слайд 51
Matched pairs t-test
compares the means for two dependent populations
(paired
Matched pairs t-test
compares the means for two dependent populations
(paired
Слайд 52
Matched pairs t-test
compares the means for two dependent populations
(paired
Matched pairs t-test
compares the means for two dependent populations
(paired
Слайд 53Exercise (15)
Exercise (15)
Слайд 54
Exercise (15):
An instructor of Anatomy course wants to know if student
Exercise (15):
An instructor of Anatomy course wants to know if student
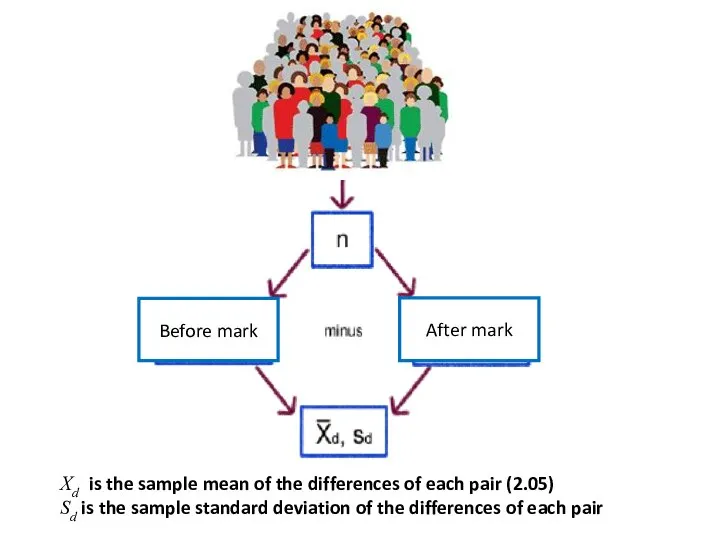
Слайд 55Xd is the sample mean of the differences of each pair (2.05)
Sd
Xd is the sample mean of the differences of each pair (2.05)
Sd

Слайд 57
Data were typed and analyzed using SPSS software program. The level
Data were typed and analyzed using SPSS software program. The level
Слайд 58Formulate general Research Question
Procedures of Hypotheses Testing and the Scientific Method
Design
Formulate general Research Question
Procedures of Hypotheses Testing and the Scientific Method
Design

Слайд 59I. Formulate general Research Question
Does pregnancy have significant effect on mean Hb%?
I. Formulate general Research Question
Does pregnancy have significant effect on mean Hb%?

Слайд 60I. Formulate general Research Question
Is there a difference in students’ marks following
I. Formulate general Research Question
Is there a difference in students’ marks following
Слайд 61Formulate general Research Question
Procedures of Hypotheses Testing and the Scientific Method
Design
Formulate general Research Question
Procedures of Hypotheses Testing and the Scientific Method
Design

Слайд 62II. State Research Hypotheses
Ho: There is no difference in mean pre- and
II. State Research Hypotheses
Ho: There is no difference in mean pre- and
Слайд 63II. State Research Hypotheses
Ho: There is no difference in mean pre- and
II. State Research Hypotheses
Ho: There is no difference in mean pre- and
Слайд 64II. State Research Hypotheses
Ho: There is no difference in mean pre- and
II. State Research Hypotheses
Ho: There is no difference in mean pre- and
Слайд 65II. State Research Hypotheses
Ho: There is no difference in mean pre- and
II. State Research Hypotheses
Ho: There is no difference in mean pre- and
Слайд 66Design Research Hypotheses and Experiment
Design Research Hypotheses and Experiment

Слайд 67Formulate general Research Question
Procedures of Hypotheses Testing and the Scientific Method
Design
Formulate general Research Question
Procedures of Hypotheses Testing and the Scientific Method
Design
Слайд 68Collect and Analyze Experimental Data
Collect and Analyze Experimental Data
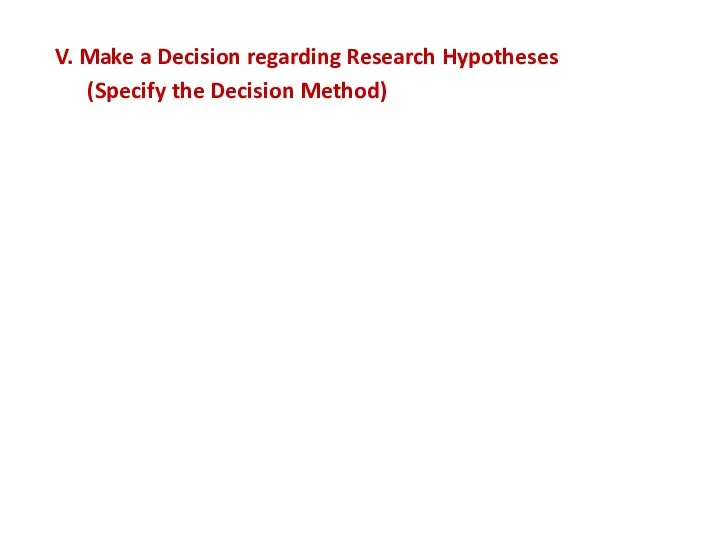
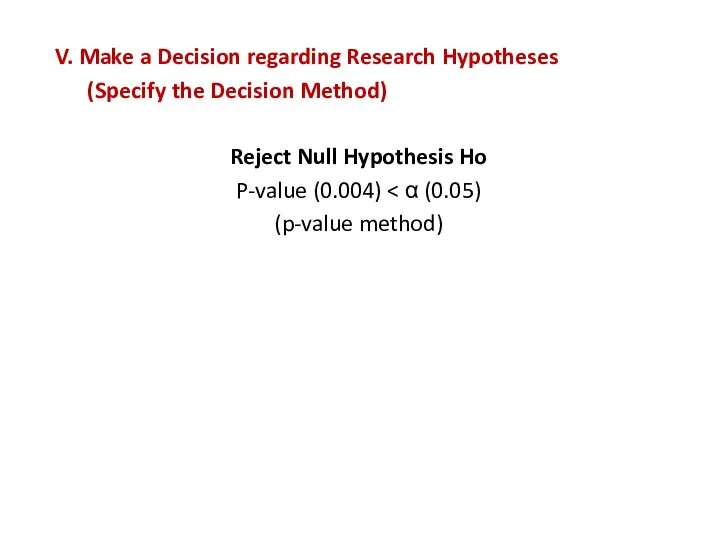
Слайд 69V. Make a Decision regarding Research Hypotheses
(Specify the Decision Method)
Reject Null
V. Make a Decision regarding Research Hypotheses
(Specify the Decision Method)
Reject Null
Слайд 70
Data were typed and analyzed using SPSS software program. The level
Data were typed and analyzed using SPSS software program. The level

Слайд 71V. Make a Decision regarding Research Hypotheses
(Specify the Decision Method)
Reject Null
V. Make a Decision regarding Research Hypotheses
(Specify the Decision Method)
Reject Null
Слайд 72Formulate general Research Question
Procedures of Hypotheses Testing and the Scientific Method
Design
Formulate general Research Question
Procedures of Hypotheses Testing and the Scientific Method
Design

Слайд 73VI. Report a conclusion
Pregnancy has a significant effect on mean Hb%.
The mean
VI. Report a conclusion
Pregnancy has a significant effect on mean Hb%.
The mean

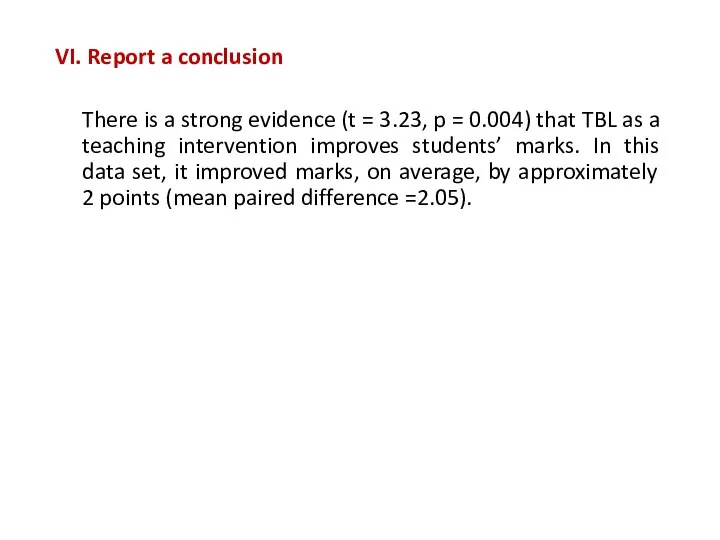
Слайд 74VI. Report a conclusion
There is a strong evidence (t = 3.23, p
VI. Report a conclusion
There is a strong evidence (t = 3.23, p
Слайд 75Xd is the sample mean of the differences of each pair (2.05)
Sd
Xd is the sample mean of the differences of each pair (2.05)
Sd
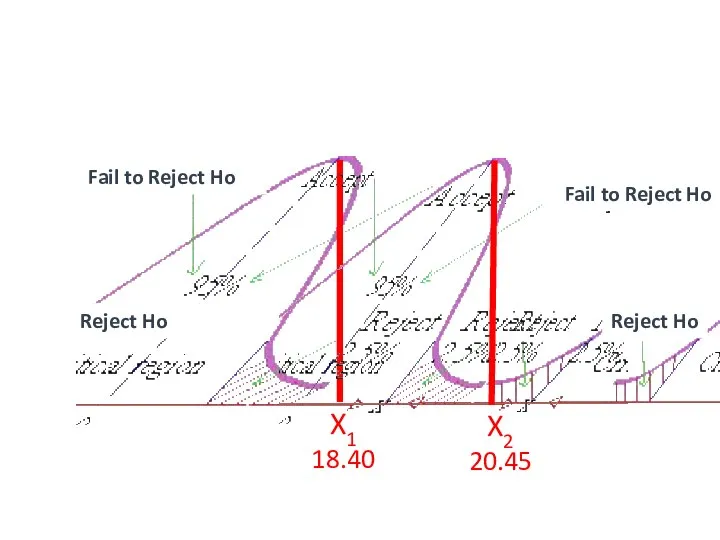
Слайд 76+1.96
-1.96
X1
18.40
X2
20.45
Fail to Reject Ho
Reject Ho
Reject Ho
Fail to Reject Ho
+1.96
-1.96
X1
18.40
X2
20.45
Fail to Reject Ho
Reject Ho
Reject Ho
Fail to Reject Ho
Слайд 77Comparing Means
(Parametric tests)
One Population Inference
Two Population Inference
Independent Sampling Model
Dependent Sampling Model
Analysis
Comparing Means
(Parametric tests)
One Population Inference
Two Population Inference
Independent Sampling Model
Dependent Sampling Model
Analysis
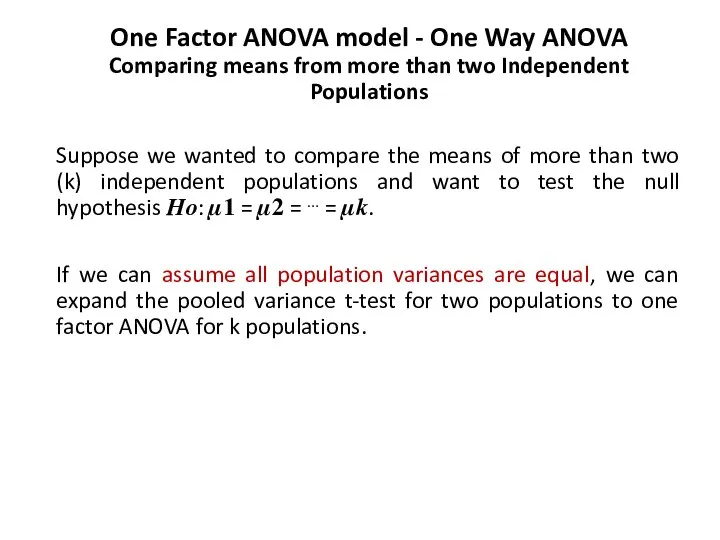
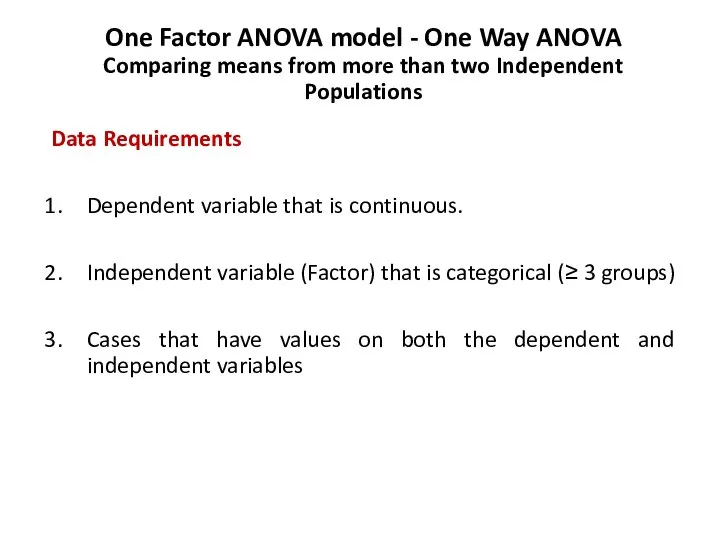
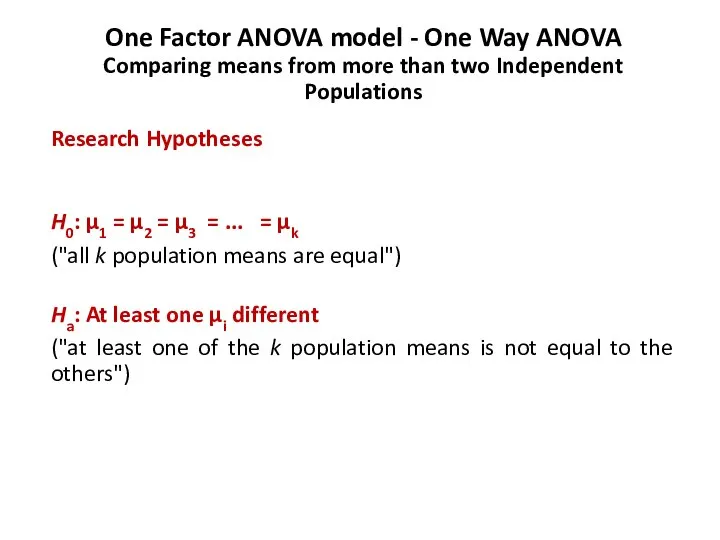
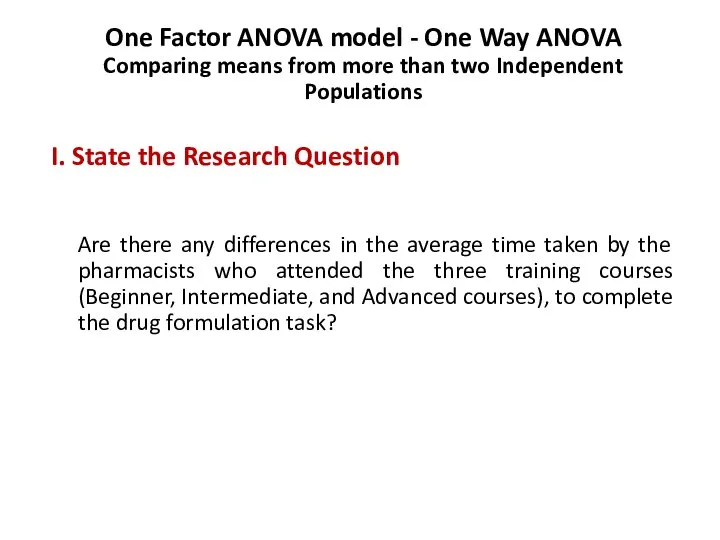
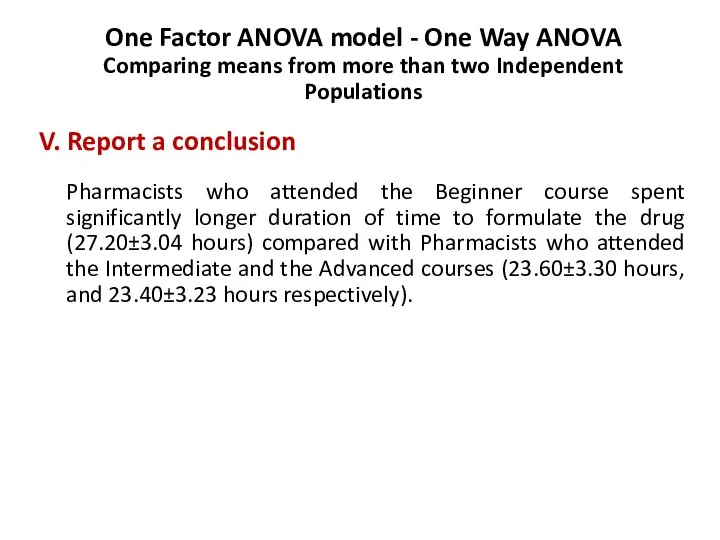
Слайд 78One Factor ANOVA model - One Way ANOVA
Comparing means from more
One Factor ANOVA model - One Way ANOVA Comparing means from more
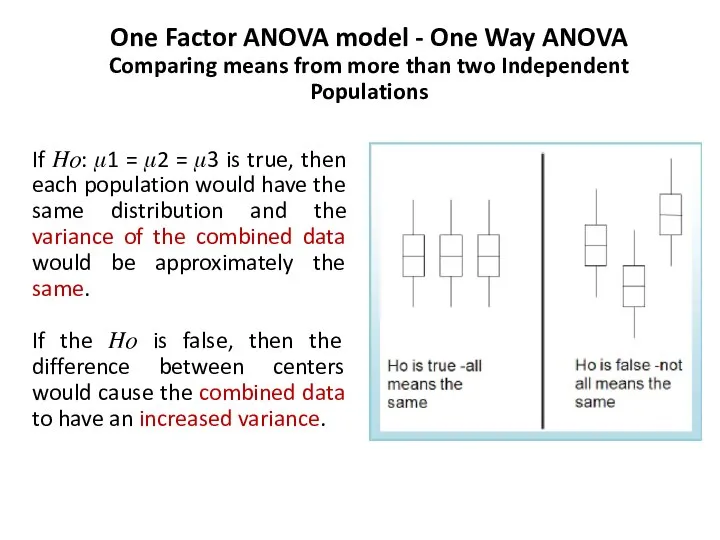
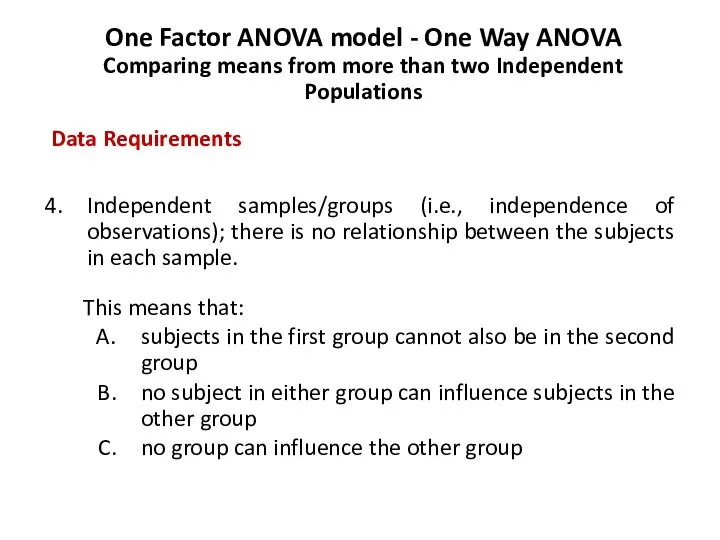
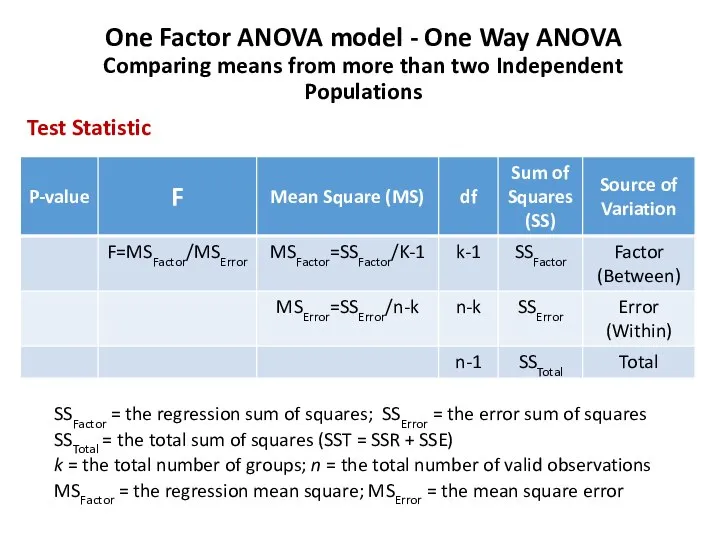
Слайд 79One Factor ANOVA model - One Way ANOVA
Comparing means from more
One Factor ANOVA model - One Way ANOVA Comparing means from more
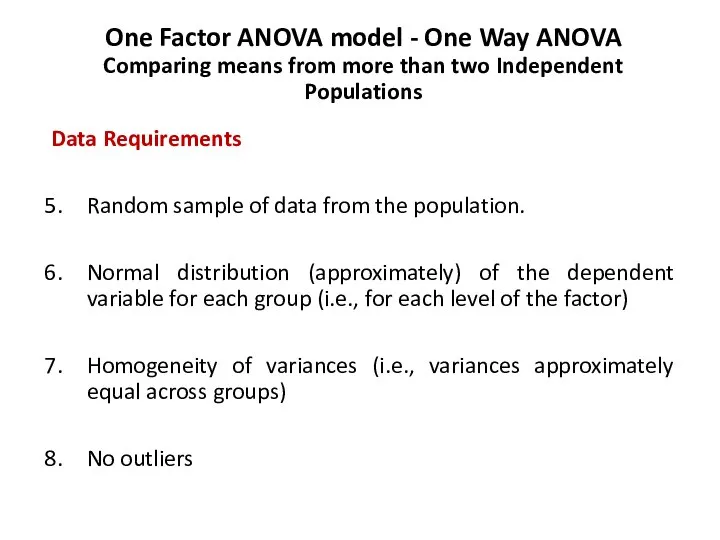
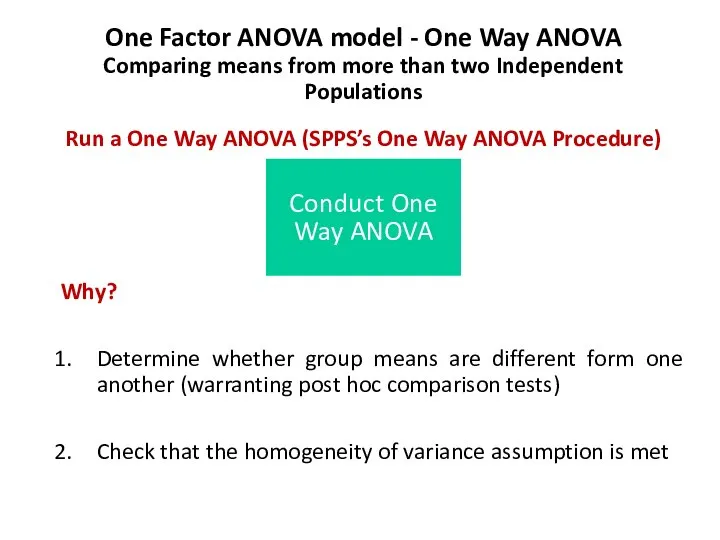
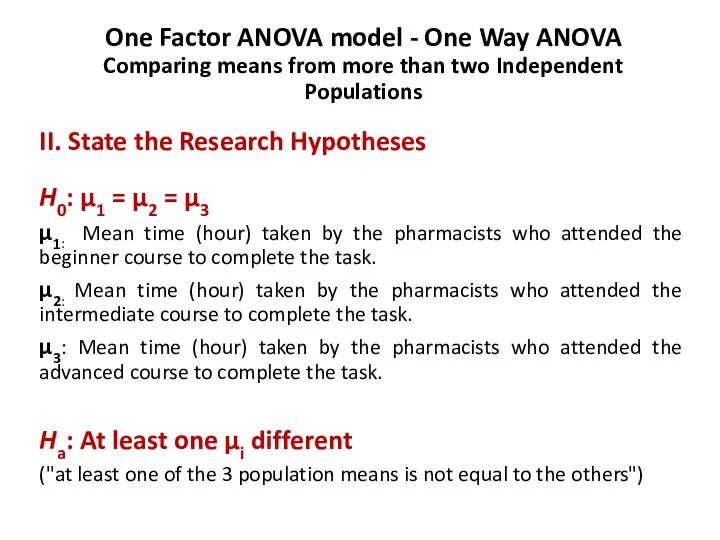
Слайд 80One Factor ANOVA model - One Way ANOVA
Comparing means from more
One Factor ANOVA model - One Way ANOVA Comparing means from more
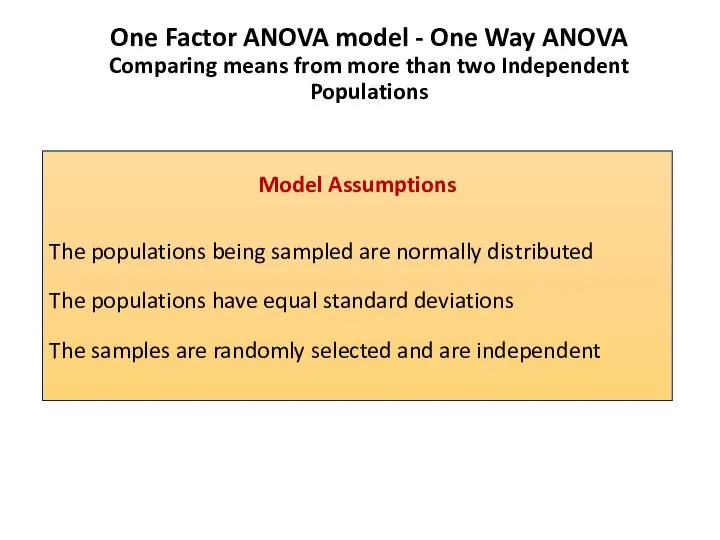
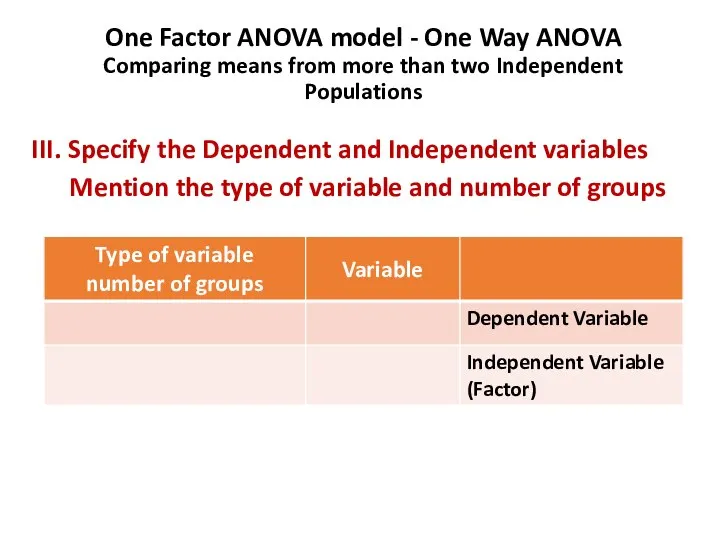
Слайд 81One Factor ANOVA model - One Way ANOVA
Comparing means from more
One Factor ANOVA model - One Way ANOVA Comparing means from more
Слайд 82One Factor ANOVA model - One Way ANOVA
Comparing means from more
One Factor ANOVA model - One Way ANOVA Comparing means from more
Слайд 83One Factor ANOVA model - One Way ANOVA
Comparing means from more
One Factor ANOVA model - One Way ANOVA Comparing means from more
Слайд 84One Factor ANOVA model - One Way ANOVA
Comparing means from more
One Factor ANOVA model - One Way ANOVA Comparing means from more
Слайд 85One Factor ANOVA model - One Way ANOVA
Comparing means from more
One Factor ANOVA model - One Way ANOVA Comparing means from more
Слайд 86One Factor ANOVA model - One Way ANOVA
Comparing means from more
One Factor ANOVA model - One Way ANOVA Comparing means from more

Слайд 87One Factor ANOVA model - One Way ANOVA
Comparing means from more
One Factor ANOVA model - One Way ANOVA Comparing means from more

Слайд 88One Factor ANOVA model - One Way ANOVA
Comparing means from more
One Factor ANOVA model - One Way ANOVA Comparing means from more

Слайд 89One Factor ANOVA model - One Way ANOVA
Comparing means from more
One Factor ANOVA model - One Way ANOVA Comparing means from more
Слайд 90One Factor ANOVA model - One Way ANOVA
Comparing means from more
One Factor ANOVA model - One Way ANOVA Comparing means from more

Слайд 91One Factor ANOVA model - One Way ANOVA
Comparing means from more
One Factor ANOVA model - One Way ANOVA Comparing means from more

Слайд 92One Factor ANOVA model - One Way ANOVA
Comparing means from more
One Factor ANOVA model - One Way ANOVA Comparing means from more

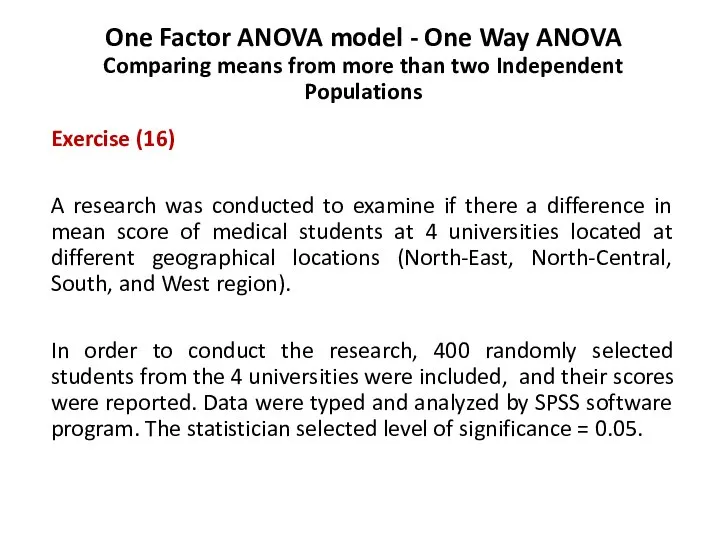
Слайд 93Exercise (16)
Exercise (16)

Слайд 94One Factor ANOVA model - One Way ANOVA
Comparing means from more
One Factor ANOVA model - One Way ANOVA Comparing means from more
Слайд 95One Factor ANOVA model - One Way ANOVA
Comparing means from more
One Factor ANOVA model - One Way ANOVA Comparing means from more

Слайд 96One Factor ANOVA model - One Way ANOVA
Comparing means from more
One Factor ANOVA model - One Way ANOVA Comparing means from more
Слайд 97One Factor ANOVA model - One Way ANOVA
Comparing means from more
One Factor ANOVA model - One Way ANOVA Comparing means from more
Слайд 98One Factor ANOVA model - One Way ANOVA
Comparing means from more
One Factor ANOVA model - One Way ANOVA Comparing means from more
Слайд 99One Factor ANOVA model - One Way ANOVA
Comparing means from more
One Factor ANOVA model - One Way ANOVA Comparing means from more
Слайд 100One Factor ANOVA model - One Way ANOVA
Comparing means from more
One Factor ANOVA model - One Way ANOVA Comparing means from more
Слайд 101Exercise (17)
Exercise (17)

Слайд 102One Factor ANOVA model - One Way ANOVA
Comparing means from more
One Factor ANOVA model - One Way ANOVA Comparing means from more
Слайд 103One Factor ANOVA model - One Way ANOVA
Comparing means from more
One Factor ANOVA model - One Way ANOVA Comparing means from more
Слайд 104One Factor ANOVA model - One Way ANOVA
Comparing means from more
One Factor ANOVA model - One Way ANOVA Comparing means from more
Слайд 105One Factor ANOVA model - One Way ANOVA
Comparing means from more
One Factor ANOVA model - One Way ANOVA Comparing means from more
Слайд 106One Factor ANOVA model - One Way ANOVA
Comparing means from more
One Factor ANOVA model - One Way ANOVA Comparing means from more
Слайд 107One Factor ANOVA model - One Way ANOVA
Comparing means from more
One Factor ANOVA model - One Way ANOVA Comparing means from more
Слайд 108One Factor ANOVA model - One Way ANOVA
Comparing means from more
One Factor ANOVA model - One Way ANOVA Comparing means from more
Слайд 109One Factor ANOVA model - One Way ANOVA
Comparing means from more
One Factor ANOVA model - One Way ANOVA Comparing means from more
Слайд 110One Factor ANOVA model - One Way ANOVA
Comparing means from more
One Factor ANOVA model - One Way ANOVA Comparing means from more

Слайд 111One Factor ANOVA model - One Way ANOVA
Comparing means from more
One Factor ANOVA model - One Way ANOVA Comparing means from more
Слайд 112One Factor ANOVA model - One Way ANOVA
Comparing means from more
One Factor ANOVA model - One Way ANOVA Comparing means from more
Слайд 113One Factor ANOVA model - One Way ANOVA
Comparing means from more
One Factor ANOVA model - One Way ANOVA Comparing means from more
Слайд 114Box plot graph
Box plot graph

Слайд 116One Factor ANOVA model - One Way ANOVA
Comparing means from more
One Factor ANOVA model - One Way ANOVA Comparing means from more
Слайд 117Histogram
Histogram

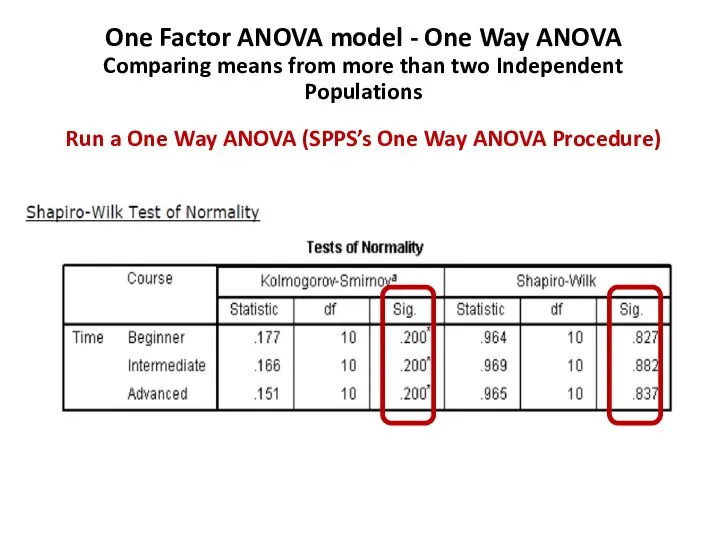
Слайд 119Tests of Normality
Tests of Normality

Слайд 120One Factor ANOVA model - One Way ANOVA
Comparing means from more
One Factor ANOVA model - One Way ANOVA Comparing means from more
Слайд 122One Factor ANOVA model - One Way ANOVA
Comparing means from more
One Factor ANOVA model - One Way ANOVA Comparing means from more
Слайд 123One Factor ANOVA model - One Way ANOVA
Comparing means from more
One Factor ANOVA model - One Way ANOVA Comparing means from more

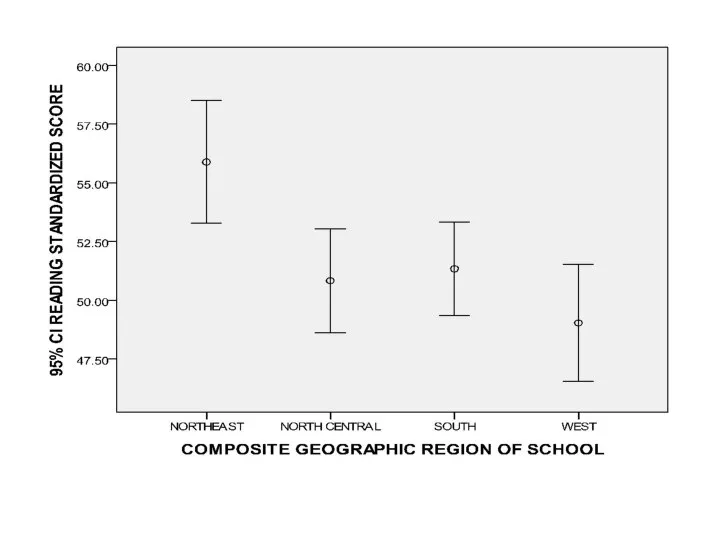
Слайд 124Error Bar graph
Error Bar graph
Слайд 126One Factor ANOVA model - One Way ANOVA
Comparing means from more
One Factor ANOVA model - One Way ANOVA Comparing means from more
Слайд 127One Factor ANOVA model - One Way ANOVA
Comparing means from more
One Factor ANOVA model - One Way ANOVA Comparing means from more

Слайд 128One Factor ANOVA model - One Way ANOVA
Comparing means from more
One Factor ANOVA model - One Way ANOVA Comparing means from more


Слайд 136One Factor ANOVA model - One Way ANOVA
Comparing means from more
One Factor ANOVA model - One Way ANOVA Comparing means from more

Слайд 137One Factor ANOVA model - One Way ANOVA
Comparing means from more
One Factor ANOVA model - One Way ANOVA Comparing means from more

Слайд 138One Factor ANOVA model - One Way ANOVA
Comparing means from more
One Factor ANOVA model - One Way ANOVA Comparing means from more

Слайд 144One Factor ANOVA model - One Way ANOVA
Comparing means from more
One Factor ANOVA model - One Way ANOVA Comparing means from more
Слайд 145One Factor ANOVA model - One Way ANOVA
Comparing means from more
One Factor ANOVA model - One Way ANOVA Comparing means from more

Слайд 146Return to Exercise (16)
Return to Exercise (16)


Слайд 149100
100
100
100
400
100
100
100
100
400

Слайд 150One Factor ANOVA model - One Way ANOVA
Comparing means from more
One Factor ANOVA model - One Way ANOVA Comparing means from more

Слайд 152One Factor ANOVA model - One Way ANOVA
Comparing means from more
One Factor ANOVA model - One Way ANOVA Comparing means from more
Слайд 153One Factor ANOVA model - One Way ANOVA
Comparing means from more
One Factor ANOVA model - One Way ANOVA Comparing means from more

Слайд 155100
100
100
100
400
100
100
100
100
400
Слайд 156One Factor ANOVA model - One Way ANOVA
Comparing means from more
One Factor ANOVA model - One Way ANOVA Comparing means from more
Слайд 157Return to Exercise (17)
Return to Exercise (17)


Слайд 161One Factor ANOVA model - One Way ANOVA
Comparing means from more
One Factor ANOVA model - One Way ANOVA Comparing means from more

Слайд 163One Factor ANOVA model - One Way ANOVA
Comparing means from more
One Factor ANOVA model - One Way ANOVA Comparing means from more
Слайд 164One Factor ANOVA model - One Way ANOVA
Comparing means from more
One Factor ANOVA model - One Way ANOVA Comparing means from more


Слайд 167One Factor ANOVA model - One Way ANOVA
Comparing means from more
One Factor ANOVA model - One Way ANOVA Comparing means from more
Слайд 168One Factor ANOVA model - One Way ANOVA
Comparing means from more
One Factor ANOVA model - One Way ANOVA Comparing means from more
Слайд 169Comparing Means
(Parametric tests)
One Population Inference
Two Population Inference
Independent Sampling Model
Dependent Sampling Model
Analysis
Comparing Means
(Parametric tests)
One Population Inference
Two Population Inference
Independent Sampling Model
Dependent Sampling Model
Analysis


 Особенности сестринского ухода
 Кеуде органдарының рентгент суреттері интерпретациялау
 Соціальні процеси: Показники розповсюдження ВІЛ/Снід
 Игровые упражнения для предупреждения и коррекции нарушений письменной речи у младших школьников с ОВЗ
 Гипоксия и нипероксия. (Лекция 13)
 Губы VIVACY
 Тема 3. Биологические опасности и защита от них (1)
 Методы лабораторной диагностики в работе фельдшерско-акушерских пунктов
 Диагностика заболеваний органов дыхания
 Внедрение дистанционного описания суточного мониторирования ЭКГ в Челябинской области
 Порто-кавальные и кава-кавальные венозные анастомозы
 Первая помощь при ранах,травмах
 Депрессия. Причины возникновения депрессии
 Особенности выявления и диагностическое значение выявления глюкозурии
 Непрерывный обвивной шов. Занятие 4
 Менингококковая инфекция
 Виды ущемления грыж
 colon
colon О клинико-лабораторном обследовании детей, выезжающих в летние оздоровительные учреждения
 Төребек,Жәнібек,Айтмұхамет1
 Жизненный цикл ВИЧ
 вакцины Гезалян
 Исследование эякулята
 Персональный биобанкинг BBS. Комплект услуг
 Valvular heart disease
 Calcarea carbonica (Калькареа карбоника)
 Синдром гомоцистонурия
 Артериальная гипертензия