- Pricing

Содержание
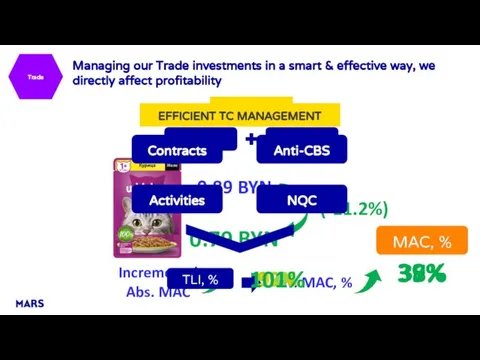
- 2. TPR ROI > 1.4 Trade Incremental Abs. MAC 35% 36% 37% 38% 39% MAC, % PROMO
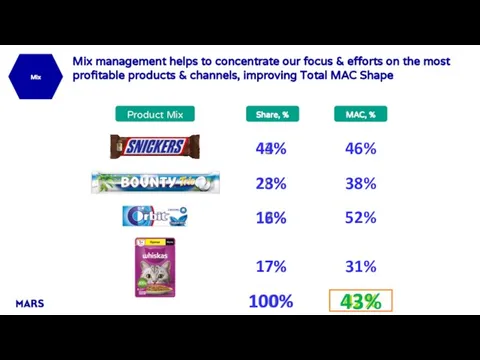
- 3. Product Mix 43% Mix 28% 12% 17% Share, % 46% 38% 52% 31% 100% 42% 44%
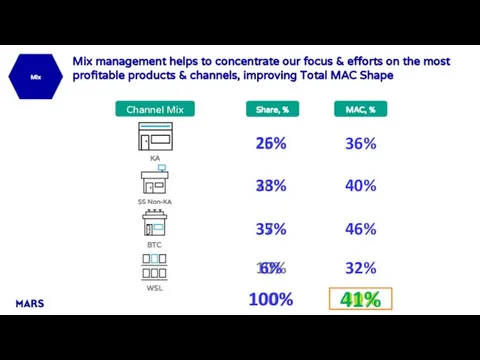
- 4. Channel Mix 25% Mix 28% 37% 10% Share, % 36% 40% 46% 32% 100% 40% 26%
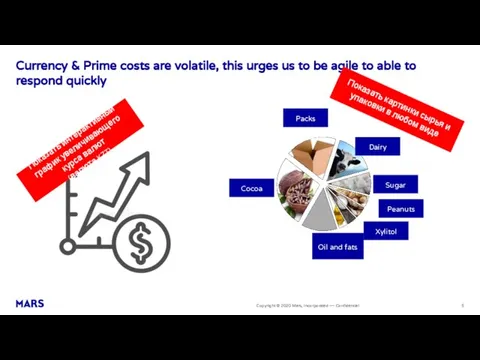
- 5. Currency & Prime costs are volatile, this urges us to be agile to able to respond
- 7. Скачать презентацию
Слайд 2TPR
ROI > 1.4
Trade
Incremental
Abs. MAC
35%
36%
37%
38%
39%
MAC, %
PROMO
Managing our Trade investments in a smart &
TPR
ROI > 1.4
Trade
Incremental
Abs. MAC
35%
36%
37%
38%
39%
MAC, %
PROMO
Managing our Trade investments in a smart &
Слайд 3Product Mix
43%
Mix
28%
12%
17%
Share, %
46%
38%
52%
31%
100%
42%
44%
23%
16%
17%
43%
Mix management helps to concentrate our focus & efforts on
Product Mix
43%
Mix
28%
12%
17%
Share, %
46%
38%
52%
31%
100%
42%
44%
23%
16%
17%
43%
Mix management helps to concentrate our focus & efforts on
Слайд 4Channel Mix
25%
Mix
28%
37%
10%
Share, %
36%
40%
46%
32%
100%
40%
26%
33%
35%
6%
41%
Mix management helps to concentrate our focus & efforts on
Channel Mix
25%
Mix
28%
37%
10%
Share, %
36%
40%
46%
32%
100%
40%
26%
33%
35%
6%
41%
Mix management helps to concentrate our focus & efforts on
Слайд 5Currency & Prime costs are volatile, this urges us to be agile
Currency & Prime costs are volatile, this urges us to be agile
 Платформа анализа конкурентов и поиска товаров с гарантированными продажами
 Презентация на тему М.Шолохов Судьба человека
  Семейство Астровые или Сложноцветные
 Куликовская битва 4 класс - тест
 математики в основе число, переменная логики высказывание (логическая переменная)
 Физиологические особенности спортивной работы в разных зонах мощности
 v
v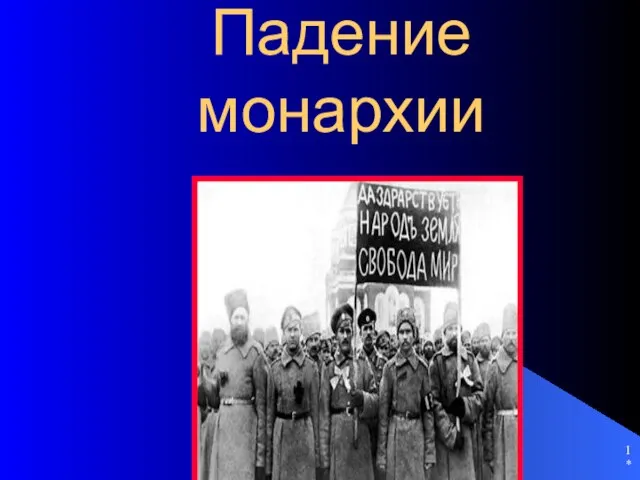 Презентация на тему Падение монархии
  ВКР: 15-ти этажный жилой многоэтажный дом
 Click to edit Master title style Click to edit Master subtitle style
  Итоги Челябинской городской правовой олимпиады «С чего начинается ПРАВО»
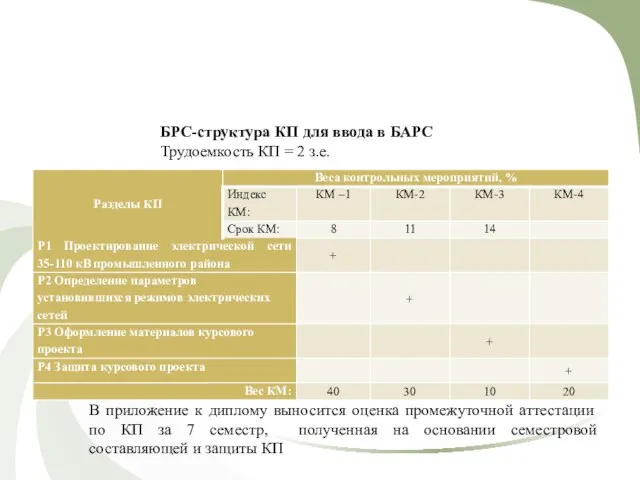 БРС-структура КП для ввода в БАРС
 Режим труда и отдыха
 Система воспитательной работы школы как сотрудничество и соавторство всех субъектов образовательного процесса
 О развитии инфраструктуры поддержки субъектов малого и среднего предпринимательства в Ставропольском крае
 Экологическое страхование и оценка рисков
 Телеканал Городской
 Экологический мониторинг
 Мобильные терминалы CASIO
 Дисциплинарная ответственность и ее виды
 Подготовка к ЕГЭ и предметным олимпиадам
 Ключевые задачи и компетенции менеджера по инновациям в компании
 Место психологии в системы других наук. Основные отрасли психологии. Волков. Кузнецова. Гафурова. Юсупов
 Сертификация. Лекция №3
 Презентация на тему Органы чувств
 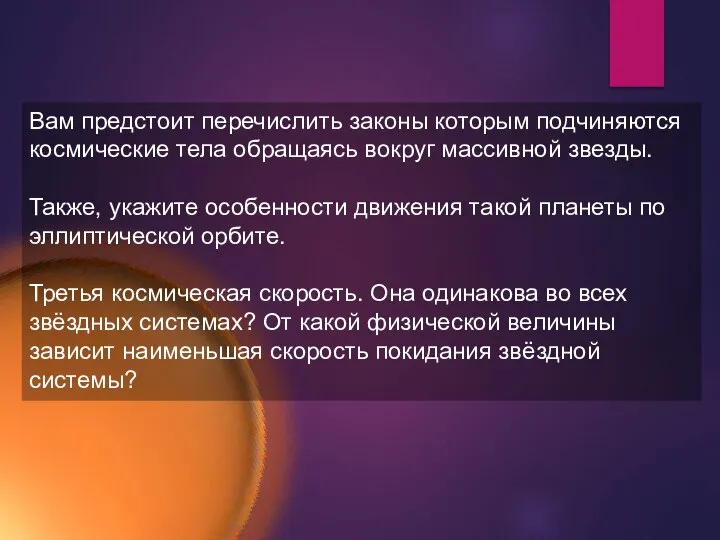 Эллиптическая орбита
 Лакокрасочные покрытия в авторемонтном производстве
 Тема урока: «Сочинение-рассказ по картине В.И. Сурикова «Взятие снежного городка».