- SIS: A system for Personal Information Retrieval and Re-Use

Содержание
- 2. Goal of SIS Finding and reusing previously used information. Make it easy for people to find
- 3. Key aspects of SIS Unified index to information from all kinds of sources on a computer
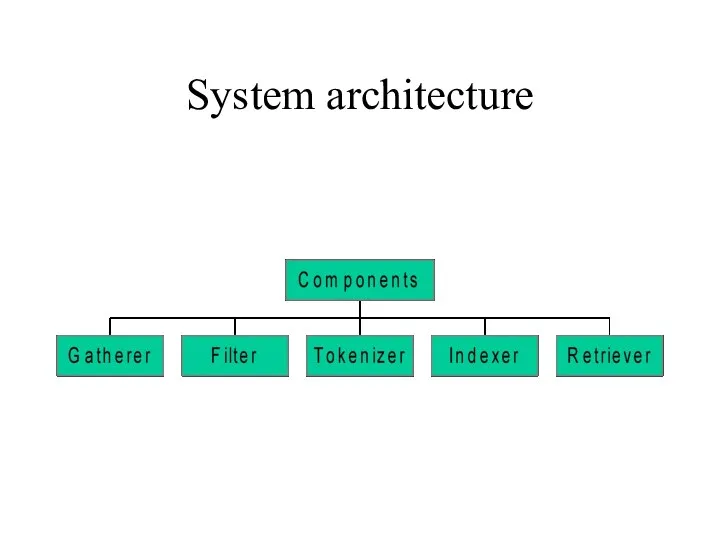
- 4. System architecture
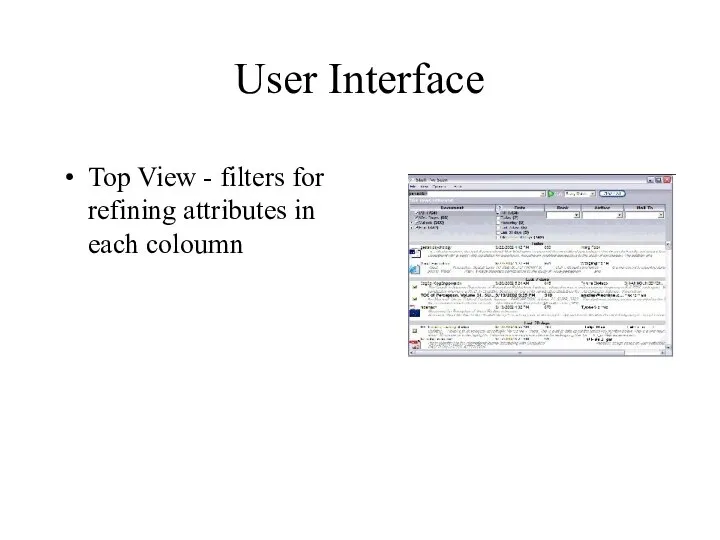
- 5. User Interface Top View - filters for refining attributes in each coloumn
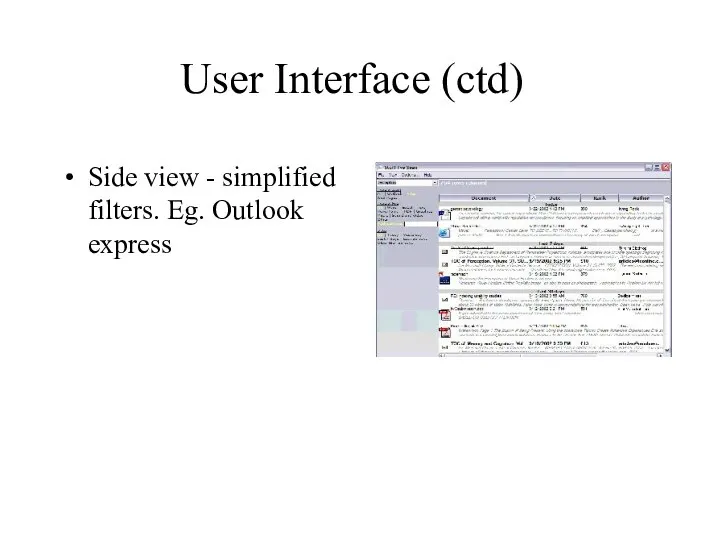
- 6. User Interface (ctd) Side view - simplified filters. Eg. Outlook express
- 7. Evaluation Log data - Detailed information on the nature of user queries, interactions with the UI
- 8. Observations 25% of queries involved people’s names, indicating people are a powerful memory cue for personal
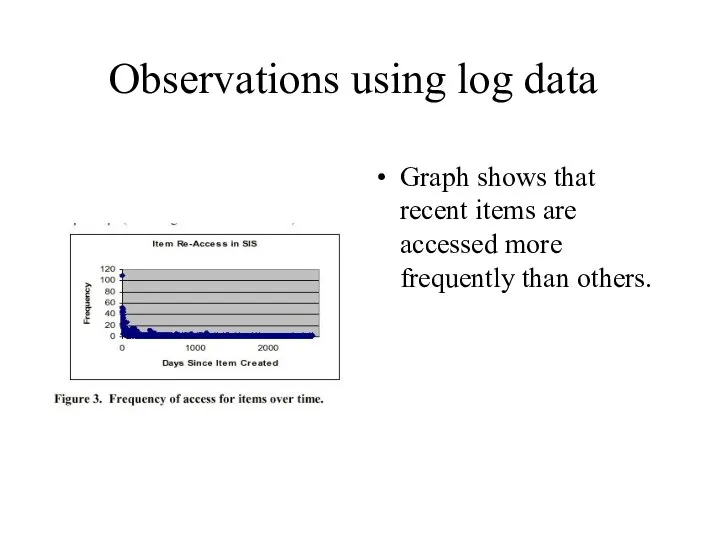
- 9. Observations using log data Graph shows that recent items are accessed more frequently than others.
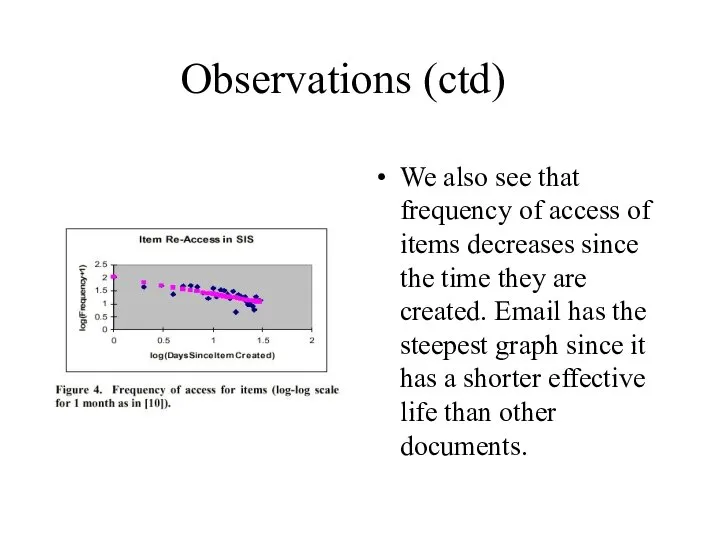
- 10. Observations (ctd) We also see that frequency of access of items decreases since the time they
- 11. User Interface observations Top view was preferred to side view Most users sorted the information by
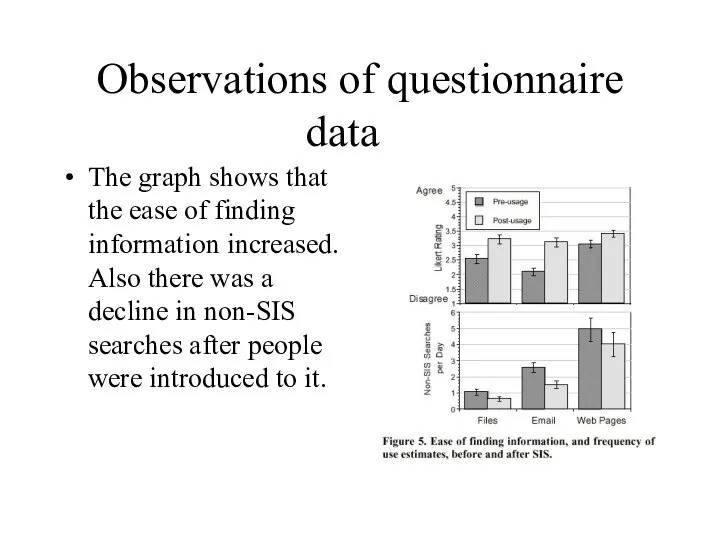
- 12. Observations of questionnaire data The graph shows that the ease of finding information increased. Also there
- 13. Review of paper No information on the implementation of their software More focus on the experiments
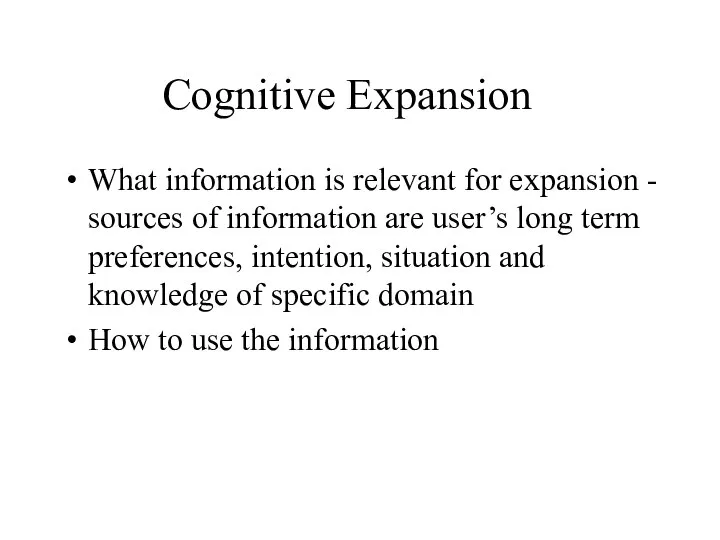
- 14. Cognitive Expansion What information is relevant for expansion - sources of information are user’s long term
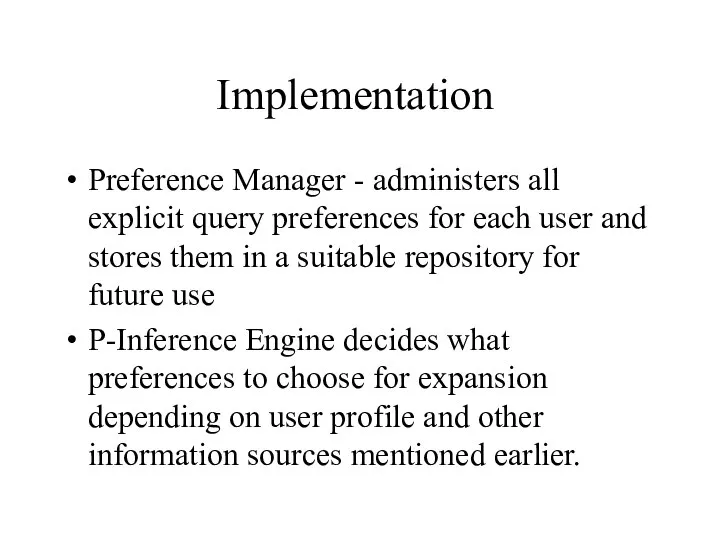
- 15. Implementation Preference Manager - administers all explicit query preferences for each user and stores them in
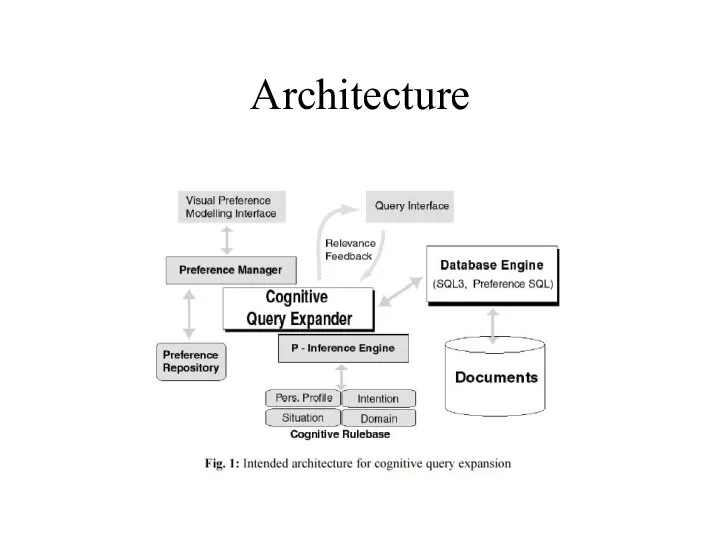
- 16. Architecture
- 18. Скачать презентацию
Слайд 3Key aspects of SIS
Unified index to information from all kinds of sources
Key aspects of SIS
Unified index to information from all kinds of sources
Слайд 4System architecture
System architecture
Слайд 5User Interface
Top View - filters for refining attributes in each coloumn
User Interface
Top View - filters for refining attributes in each coloumn
Слайд 6User Interface (ctd)
Side view - simplified filters. Eg. Outlook express
User Interface (ctd)
Side view - simplified filters. Eg. Outlook express
Слайд 7Evaluation
Log data - Detailed information on the nature of user queries, interactions
Evaluation
Log data - Detailed information on the nature of user queries, interactions
Слайд 8Observations
25% of queries involved people’s names, indicating people are a powerful memory
Observations
25% of queries involved people’s names, indicating people are a powerful memory
Слайд 9Observations using log data
Graph shows that recent items are accessed more frequently
Observations using log data
Graph shows that recent items are accessed more frequently
Слайд 10Observations (ctd)
We also see that frequency of access of items decreases since
Observations (ctd)
We also see that frequency of access of items decreases since
Слайд 11User Interface observations
Top view was preferred to side view
Most users sorted the
User Interface observations
Top view was preferred to side view
Most users sorted the
Слайд 12Observations of questionnaire data
The graph shows that the ease of finding information
Observations of questionnaire data
The graph shows that the ease of finding information
Слайд 13Review of paper
No information on the implementation of their software
More focus on
Review of paper
No information on the implementation of their software
More focus on
Слайд 14Cognitive Expansion
What information is relevant for expansion - sources of information are
Cognitive Expansion
What information is relevant for expansion - sources of information are
Слайд 15Implementation
Preference Manager - administers all explicit query preferences for each user and
Implementation
Preference Manager - administers all explicit query preferences for each user and
Слайд 16Architecture
Architecture
 Системы счисления
 Как работать с 1с не в локальной сети
 Комплексное продвижение групп ВКонтакте
 Средства массовой информации, которыми я интересуюсь
 Оформление библиографического описания
 Основы передачи дискретных сообщений. Лекция 3
 Место и роль ПКП
 Общая постановка и алгоритм решения задач динамического программирования. Тема 1.5
 ShotOut 3D
 Человек и информация
 Моделирование в среде графического редактора (урок информатики)
 Циклы по переменной. Программирование на языке Python
 Видеоблогинг. Мастер-класс
 Пэкмен. Обзор. Скайрим – моя жизнь
 Процесс разработки программного обеспечения
 Операционная система
 Вещественные числа
 Adobe Photoshop
 Региональная геоинформационная система Новосибирской области
 Разработка программного модуля для визуализации и аналитики данных
 Круги Эйлера
 Instrukcja instalacji programu Maestro System operacyjny Windows
 Градиент, фон, фильтр
 Текстовый процессор Writer
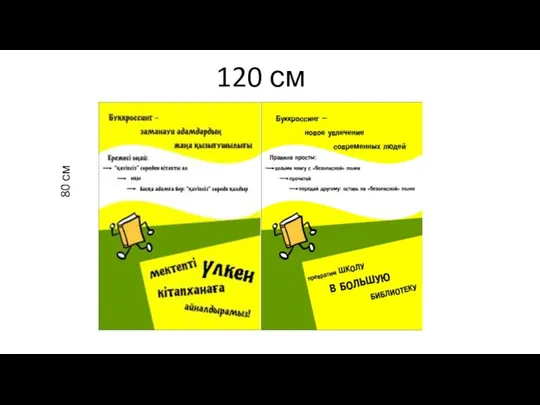 Буккроссинг - новое увлечение современных людей
 Операторы цикла
 Интерактивный тест по информатике
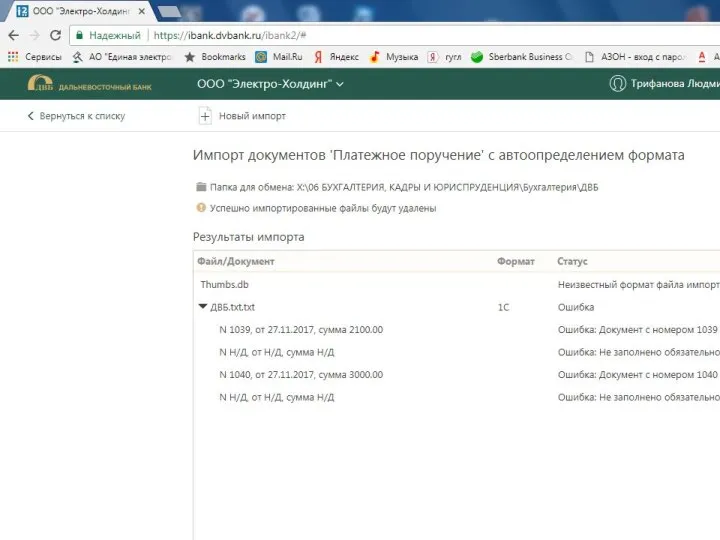 Импорт документов. Платежное поручение с автоопределением формата