- Identity Economics….. and Inequality

Содержание
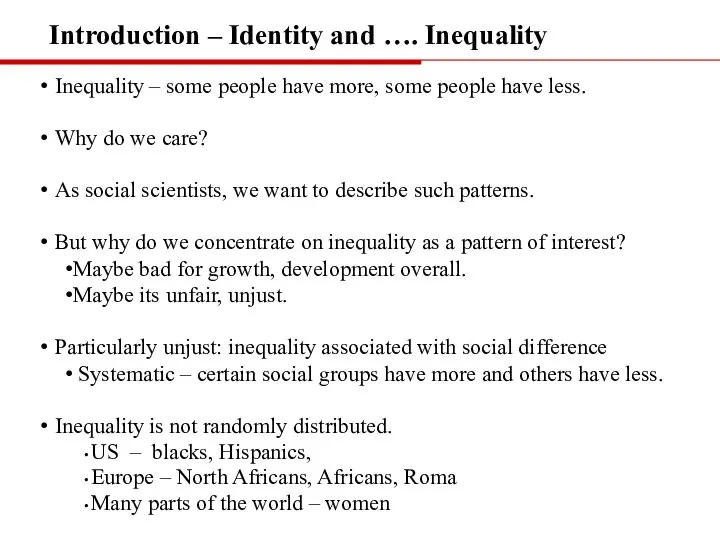
- 2. Introduction – Identity and …. Inequality Inequality – some people have more, some people have less.
- 3. Introduction – Social Categories Identity – At a minimum a designator of a social group. How
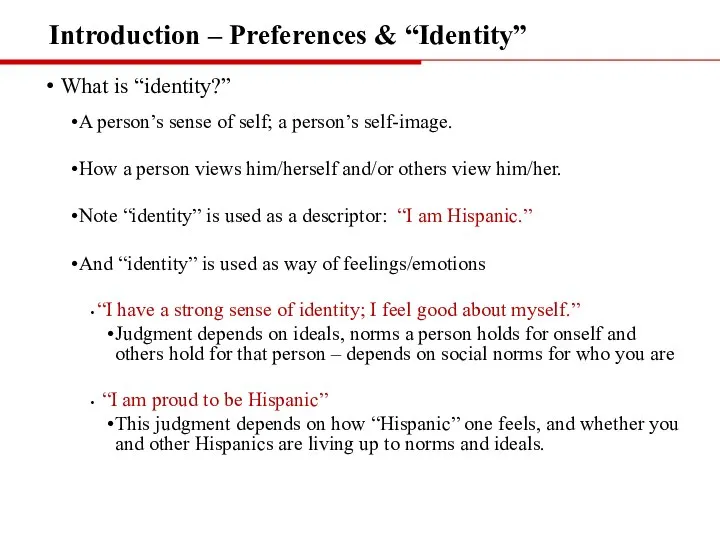
- 4. Introduction – Preferences & “Identity” What is “identity?” A person’s sense of self; a person’s self-image.
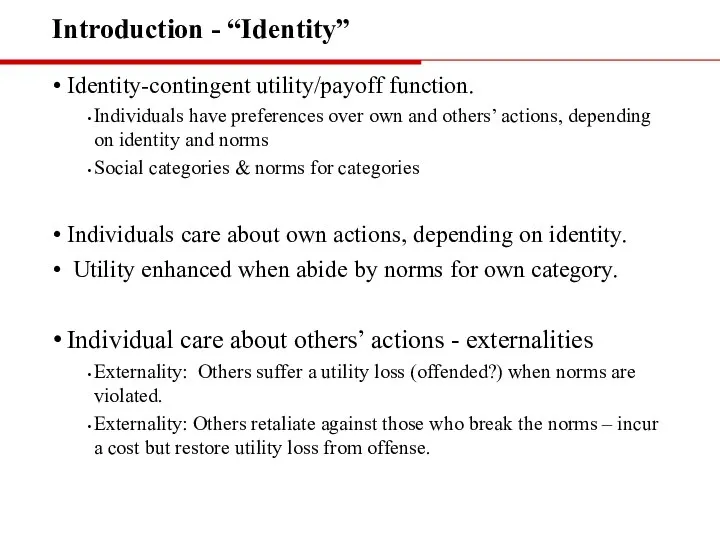
- 5. Introduction - “Identity” Identity-contingent utility/payoff function. Individuals have preferences over own and others’ actions, depending on
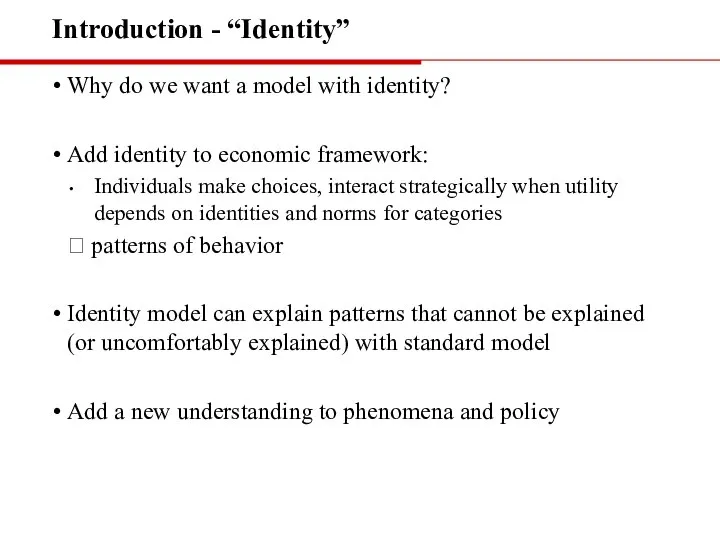
- 6. Introduction - “Identity” Why do we want a model with identity? Add identity to economic framework:
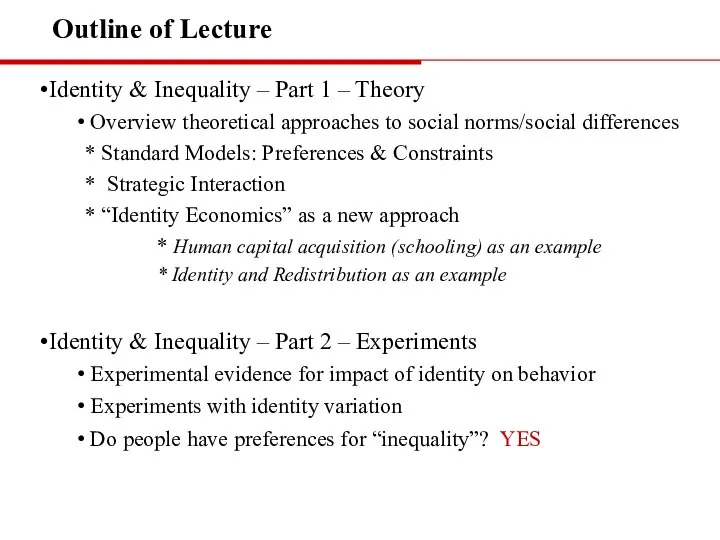
- 7. Outline of Lecture Identity & Inequality – Part 1 – Theory Overview theoretical approaches to social
- 8. Identity and Inequality Part 1 Economic Theory Rachel E. Kranton HCEO Summer School 2021
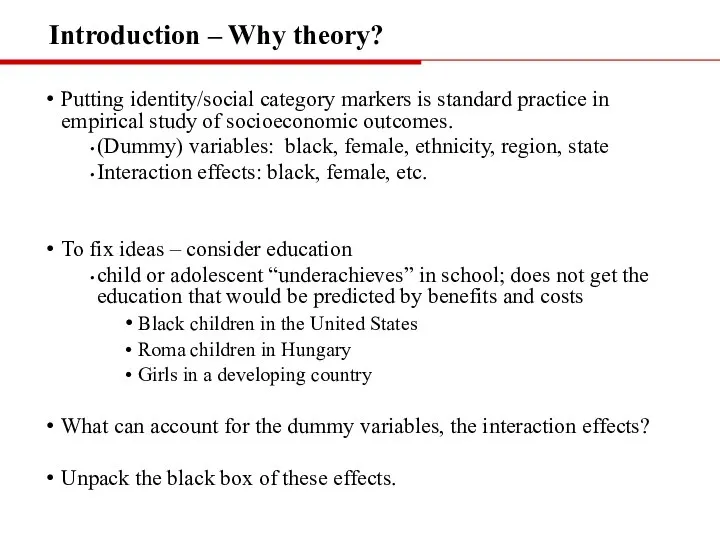
- 9. Introduction – Why theory? Putting identity/social category markers is standard practice in empirical study of socioeconomic
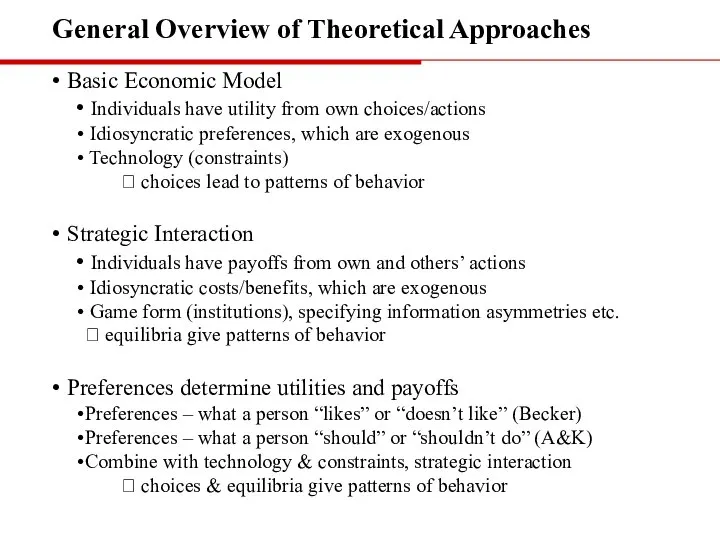
- 10. General Overview of Theoretical Approaches Basic Economic Model Individuals have utility from own choices/actions Idiosyncratic preferences,
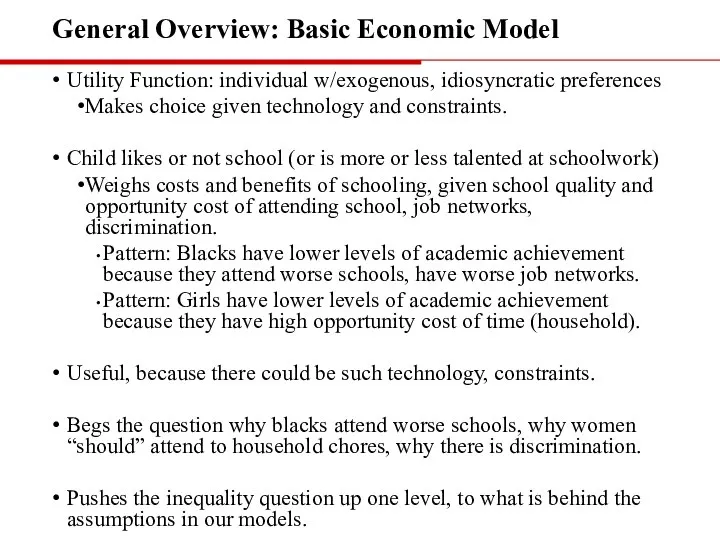
- 11. General Overview: Basic Economic Model Utility Function: individual w/exogenous, idiosyncratic preferences Makes choice given technology and
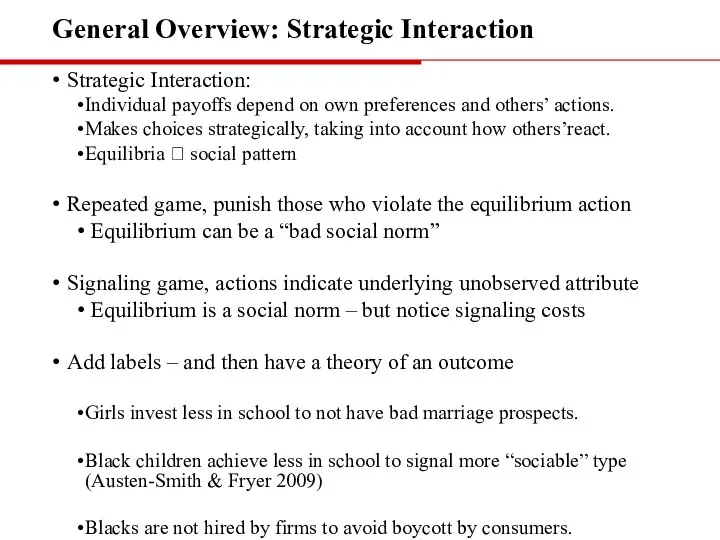
- 12. General Overview: Strategic Interaction Strategic Interaction: Individual payoffs depend on own preferences and others’ actions. Makes
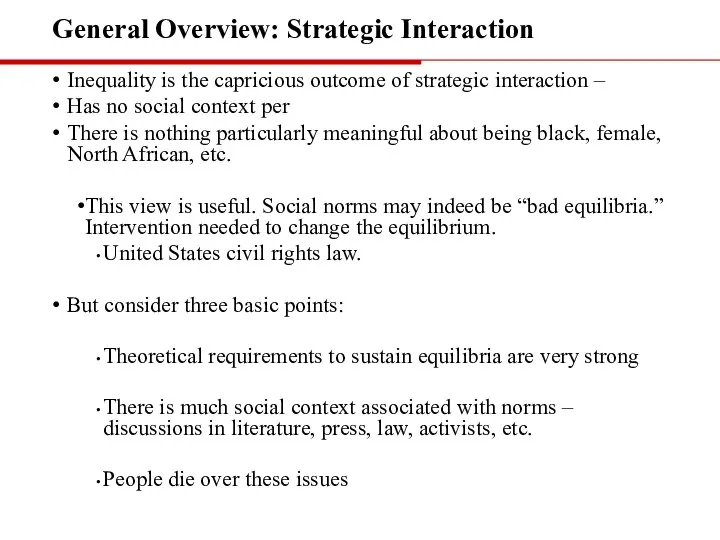
- 13. General Overview: Strategic Interaction Inequality is the capricious outcome of strategic interaction – Has no social
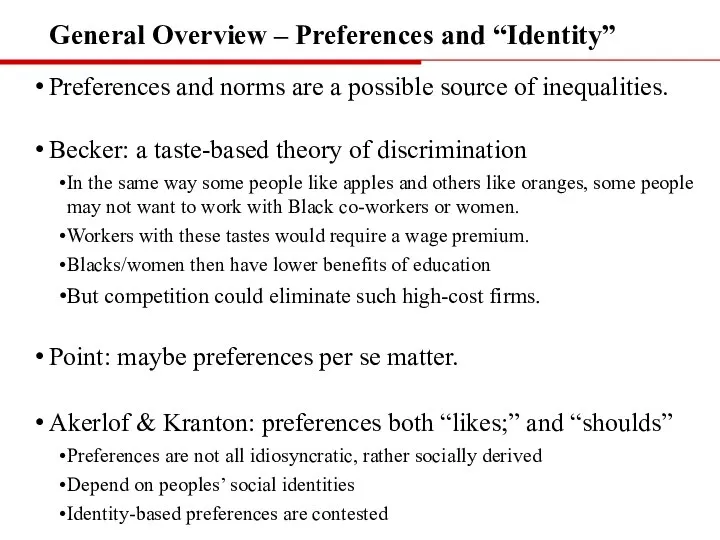
- 14. General Overview – Preferences and “Identity” Preferences and norms are a possible source of inequalities. Becker:
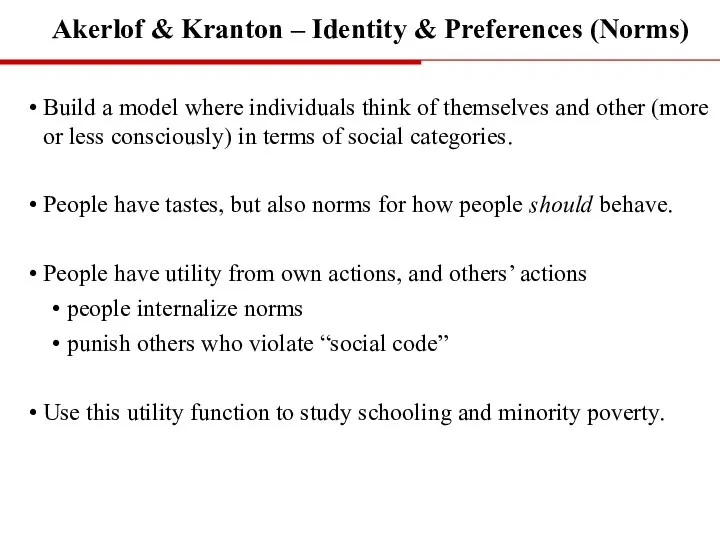
- 15. Akerlof & Kranton – Identity & Preferences (Norms) Build a model where individuals think of themselves
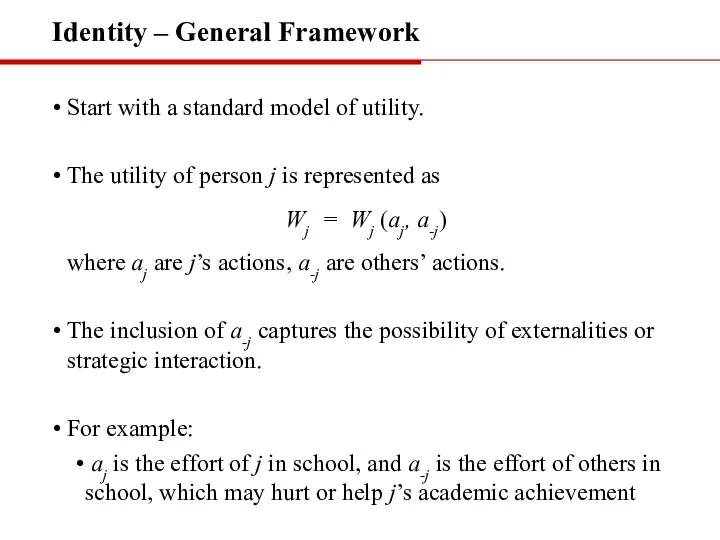
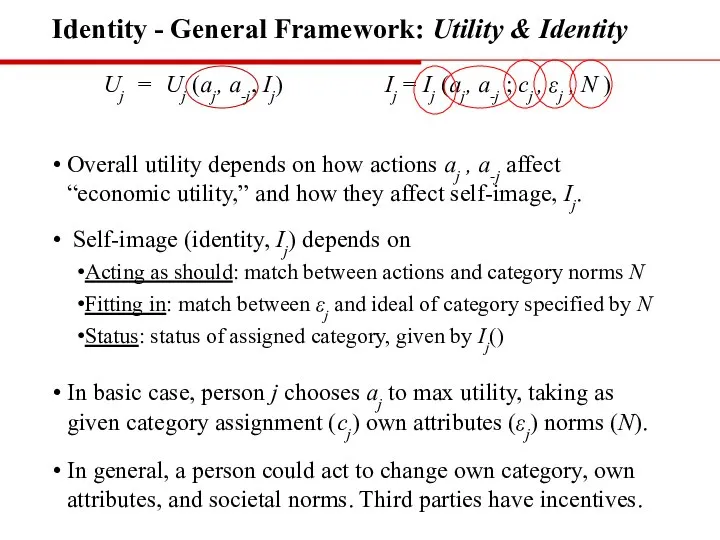
- 16. Identity – General Framework Start with a standard model of utility. The utility of person j
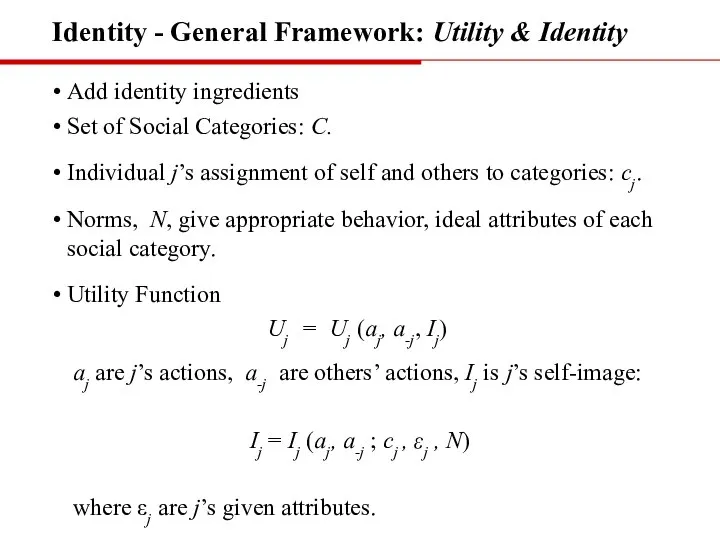
- 17. Identity - General Framework: Utility & Identity Add identity ingredients Set of Social Categories: C. Individual
- 18. Identity - General Framework: Utility & Identity Uj = Uj (aj, a-j, Ij) Ij = Ij
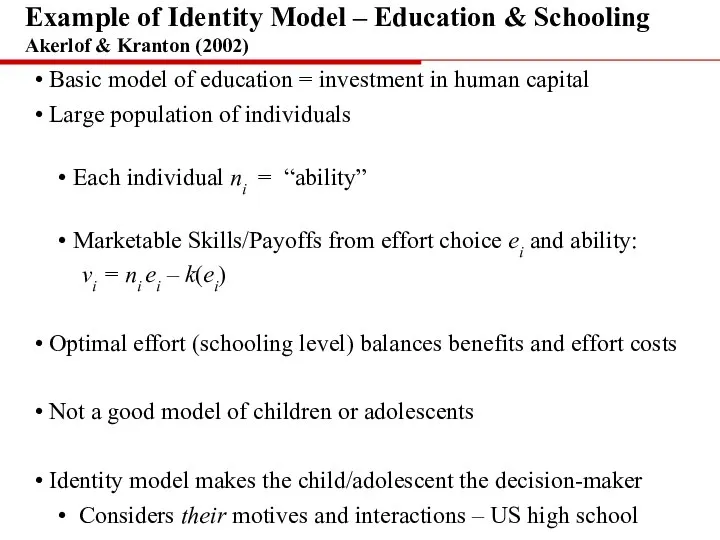
- 19. Example of Identity Model – Education & Schooling Akerlof & Kranton (2002) Basic model of education
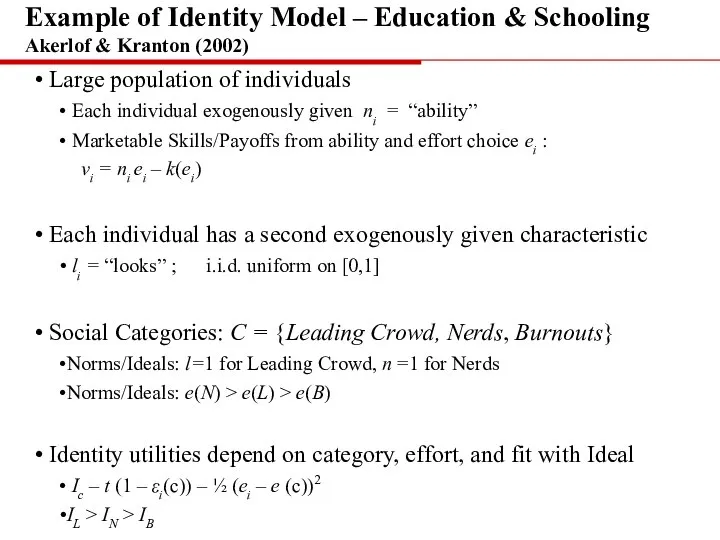
- 20. Large population of individuals Each individual exogenously given ni = “ability” Marketable Skills/Payoffs from ability and
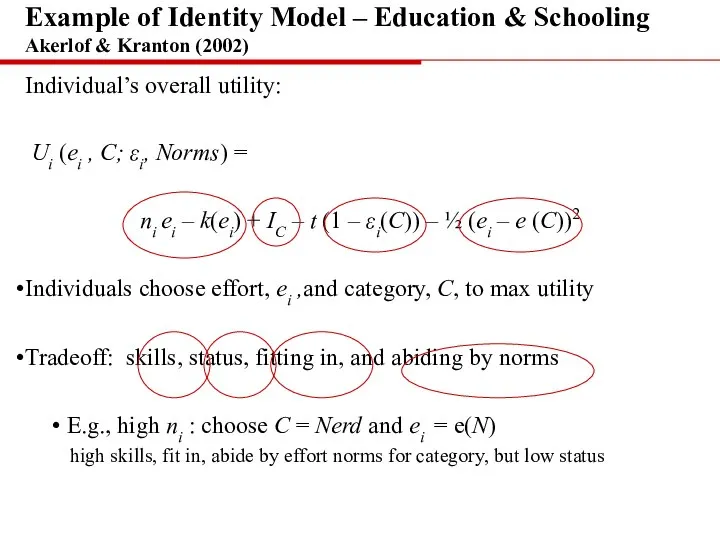
- 21. Individual’s overall utility: Ui (ei , C; εi, Norms) = ni ei – k(ei) + IC
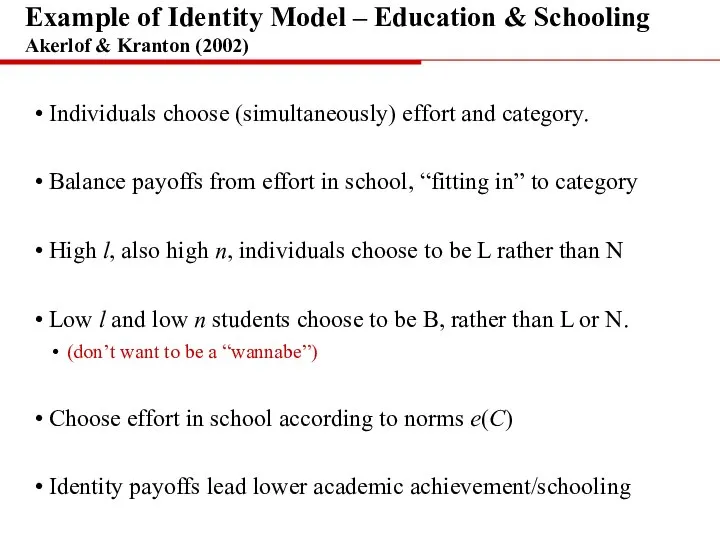
- 22. Individuals choose (simultaneously) effort and category. Balance payoffs from effort in school, “fitting in” to category
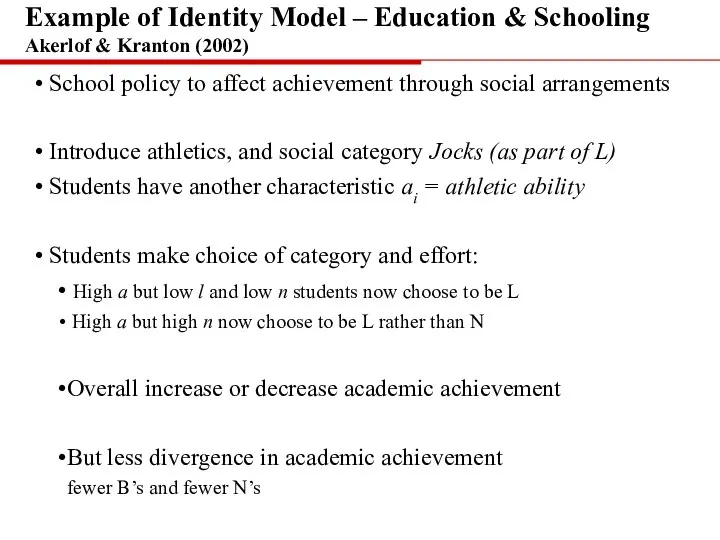
- 23. School policy to affect achievement through social arrangements Introduce athletics, and social category Jocks (as part
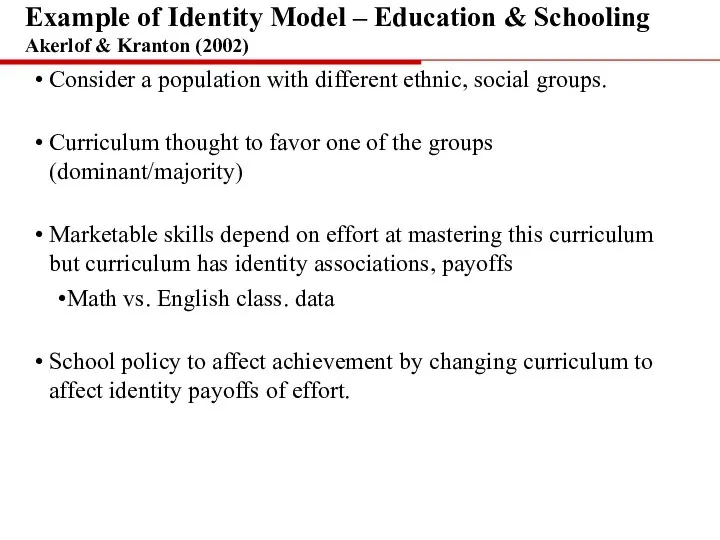
- 24. Consider a population with different ethnic, social groups. Curriculum thought to favor one of the groups
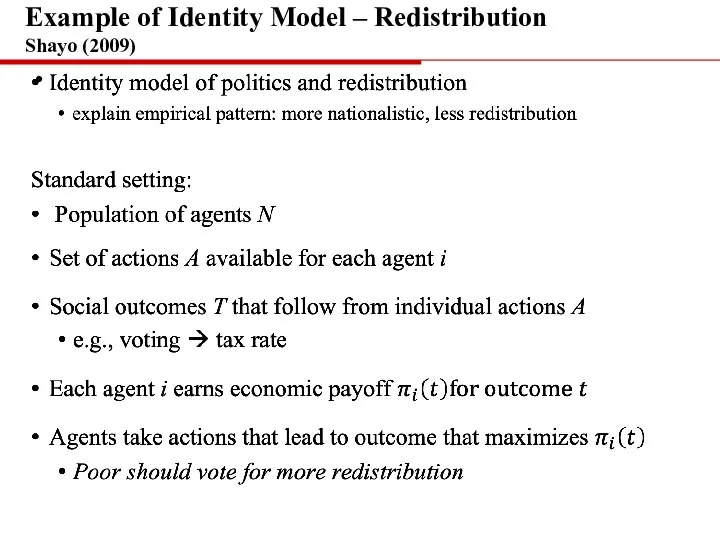
- 25. • fasdfkljas;fljk;lasjflaksjfdajfkasjhdfklasjfklsdjfkljsklfjklsfjklsdjfklsdjfklajjdsfljkaklfslfjadjf;kaljflasjflk Example of Identity Model – Redistribution Shayo (2009)
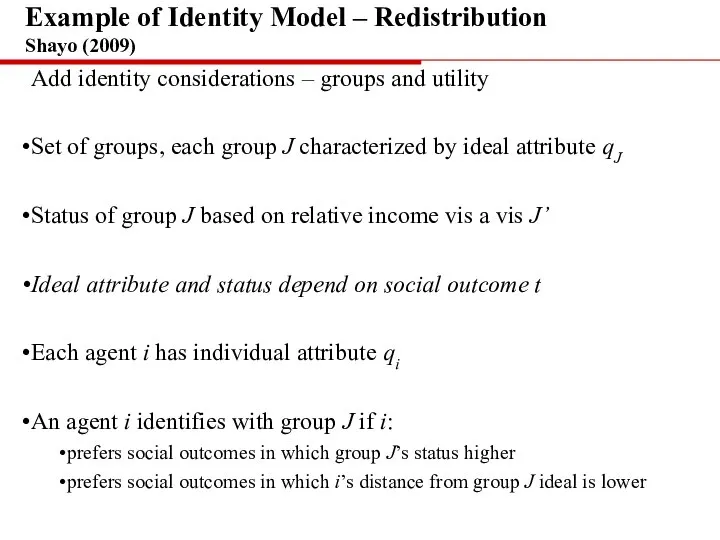
- 26. Add identity considerations – groups and utility Set of groups, each group J characterized by ideal
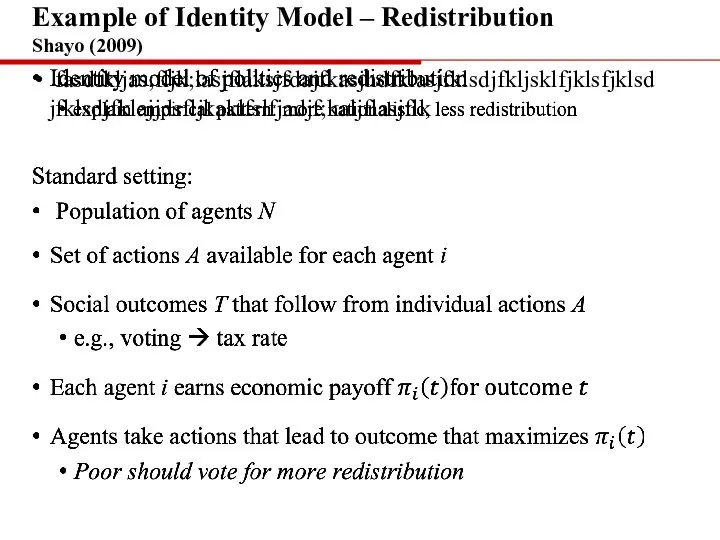
- 27. • Example of Identity Model – Redistribution Shayo (2009)
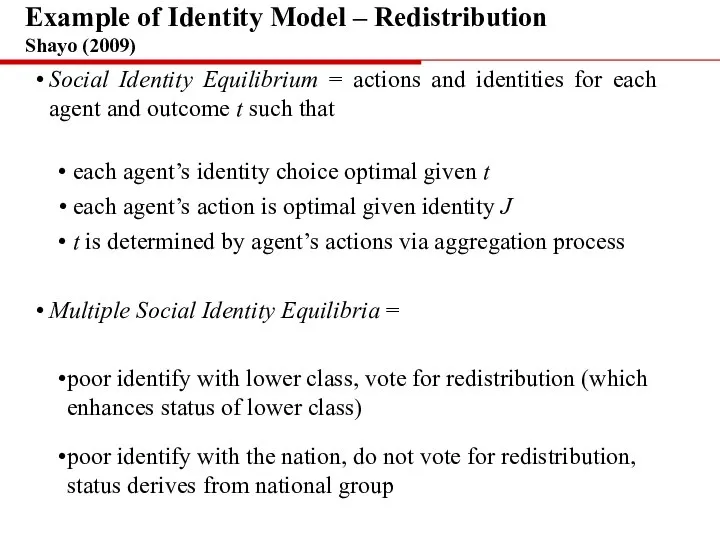
- 28. Social Identity Equilibrium = actions and identities for each agent and outcome t such that each
- 29. Identity and Inequality Part 2 Economic Experiments Rachel E. Kranton HCEO Summer School 2021
- 30. Experiments with Social Groups, Identity Do people behave differently (towards others) depending on identity/social group? Experiments
- 31. Experiments: Own Behavior “Stereotype Threat” Steele & Aronson (1995) Incentives and Stereotype Threat? “Discrimination, Social Identity
- 32. Experiments: Strategic Games “Discrimination in a Segmented Society” Fershtman & Gneezy (2001) Objective: test for “taste
- 33. Experiments: Social Preferences Social Preferences = value placed on other’s income Many experiments where subjects allocate
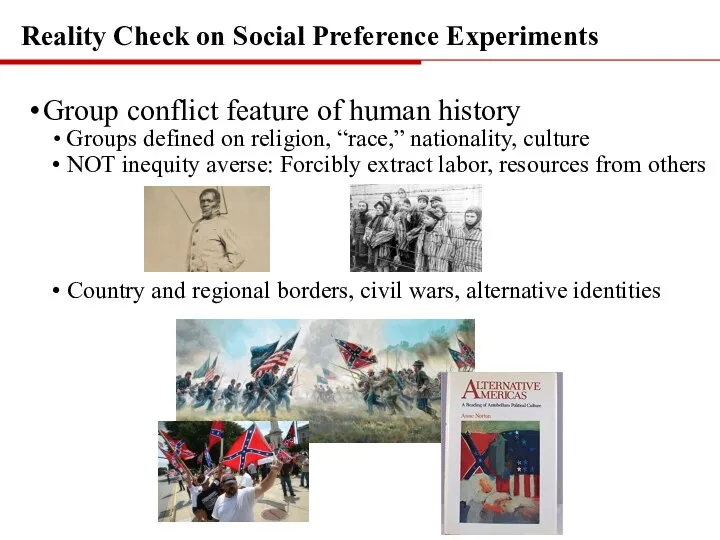
- 34. Reality Check on Social Preference Experiments Group conflict feature of human history Groups defined on religion,
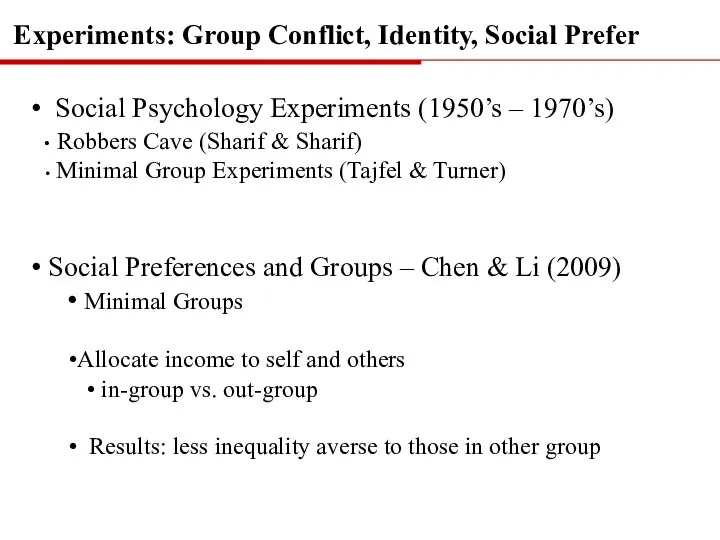
- 35. Experiments: Group Conflict, Identity, Social Prefer Social Psychology Experiments (1950’s – 1970’s) Robbers Cave (Sharif &
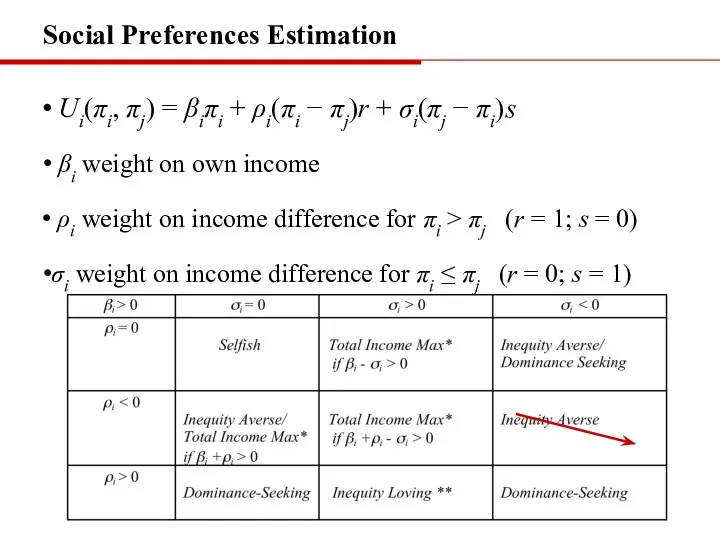
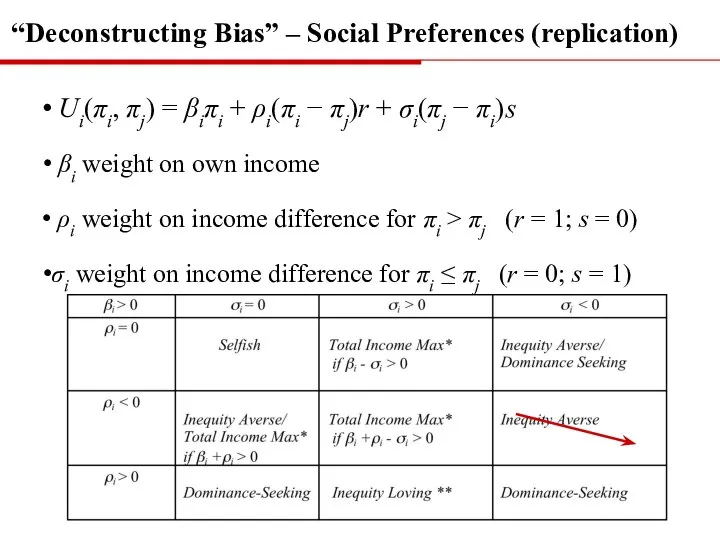
- 36. Social Preferences Estimation Ui(πi, πj) = βiπi + ρi(πi − πj)r + σi(πj − πi)s βi
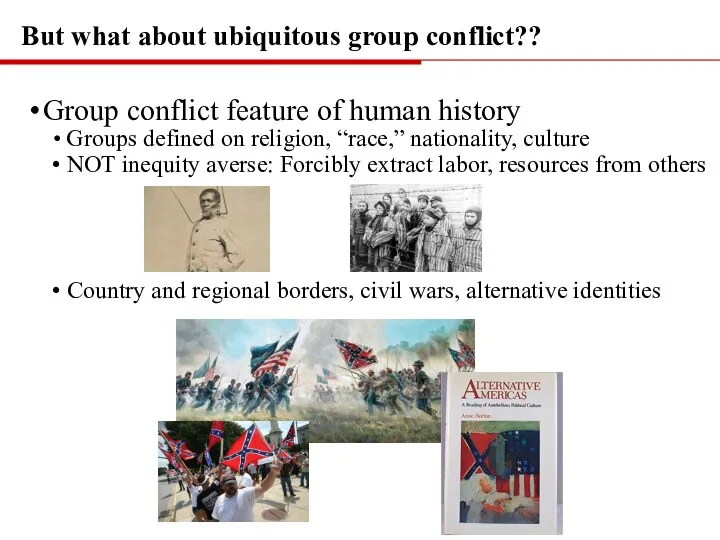
- 37. But what about ubiquitous group conflict?? Group conflict feature of human history Groups defined on religion,
- 38. “Deconstructing bias in social preferences reveals groupy and not-groupy behavior” Rachel Kranton, Matthew Pease, Seth Sanders,
- 39. “Deconstructing Bias” – Introduction Maybe stronger identification with group ? Do people who identify more with
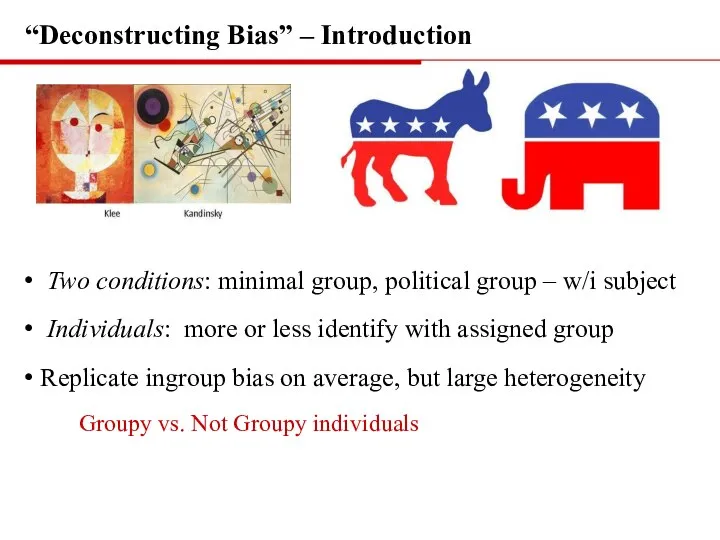
- 40. Two conditions: minimal group, political group – w/i subject Individuals: more or less identify with assigned
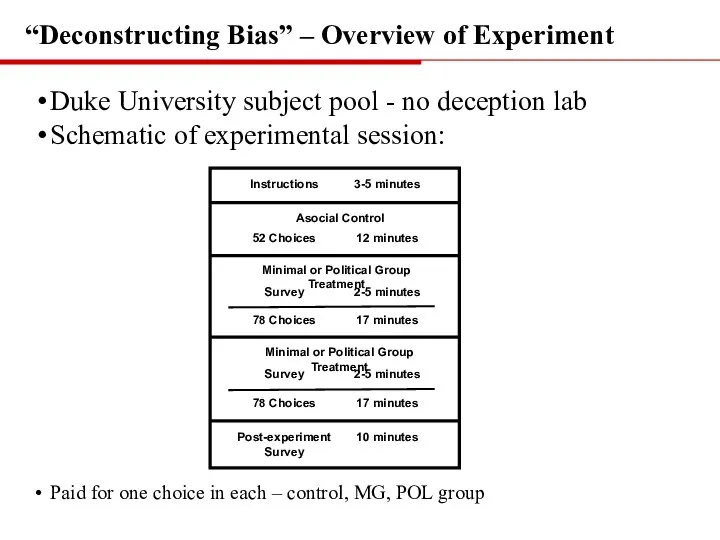
- 41. Duke University subject pool - no deception lab Schematic of experimental session: Paid for one choice
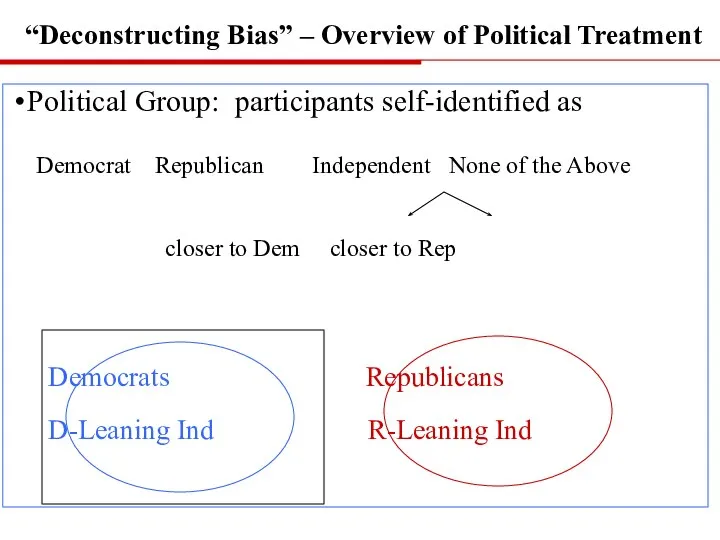
- 42. Political Group: participants self-identified as Democrat Republican Independent None of the Above closer to Dem closer
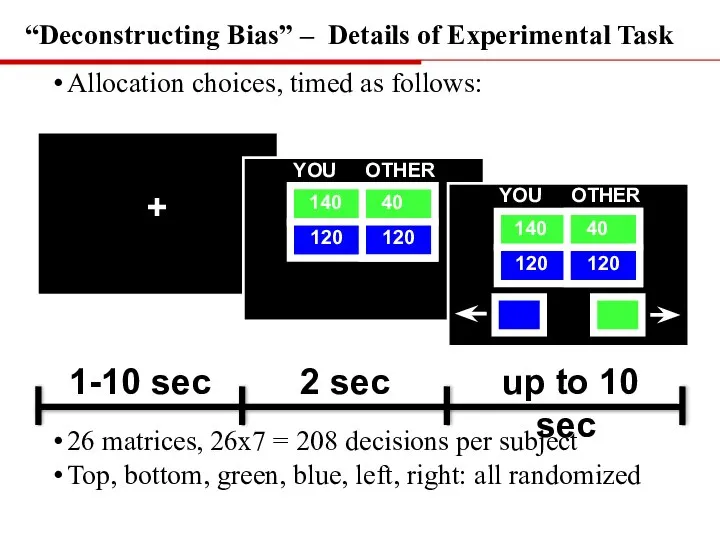
- 43. Allocation choices, timed as follows: 26 matrices, 26x7 = 208 decisions per subject Top, bottom, green,
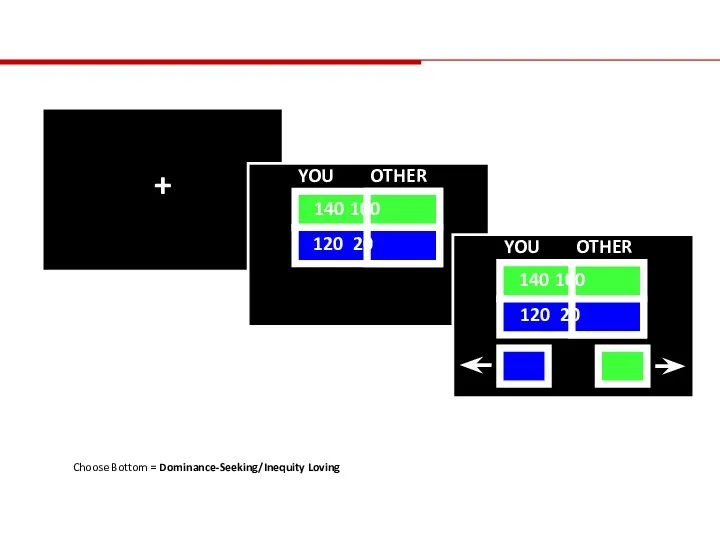
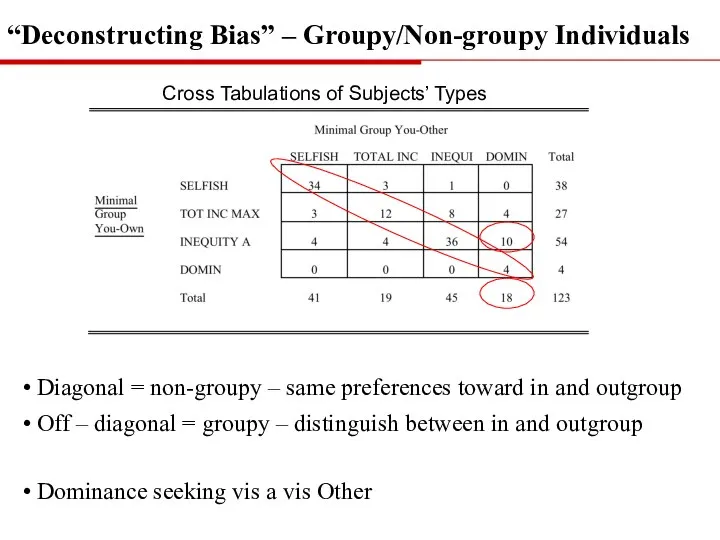
- 44. Choose Bottom = Dominance-Seeking/Inequity Loving
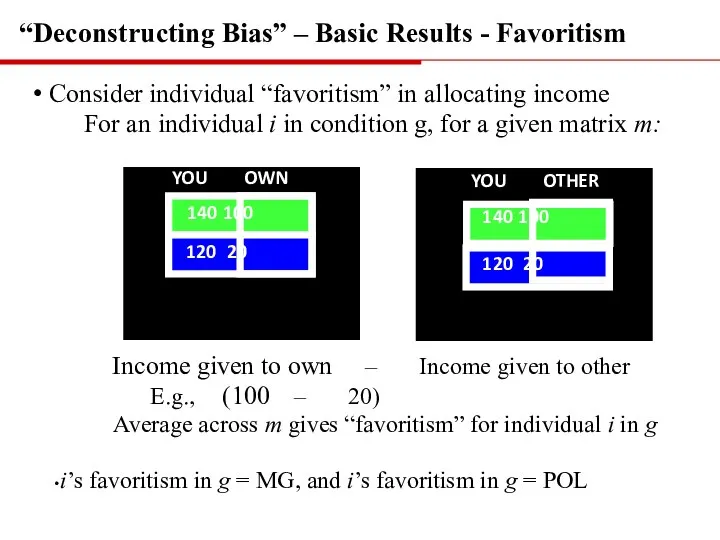
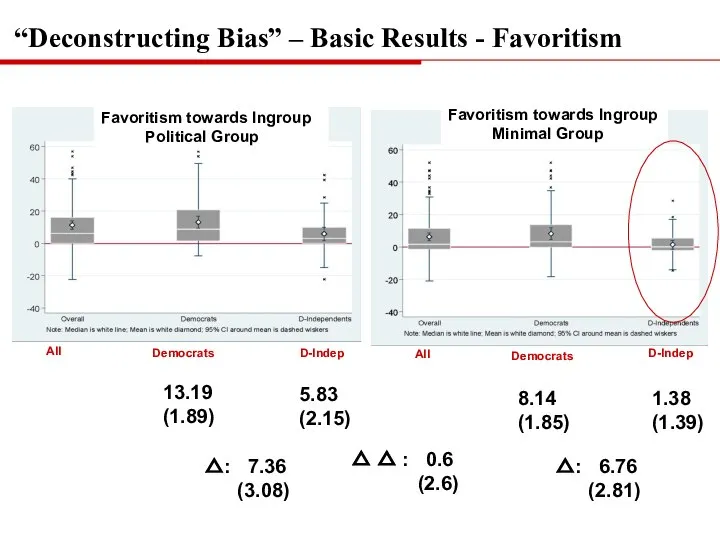
- 45. Consider individual “favoritism” in allocating income For an individual i in condition g, for a given
- 46. yes Favoritism towards Ingroup Political Group Favoritism towards Ingroup Minimal Group D-Indep Democrats Democrats D-Indep All
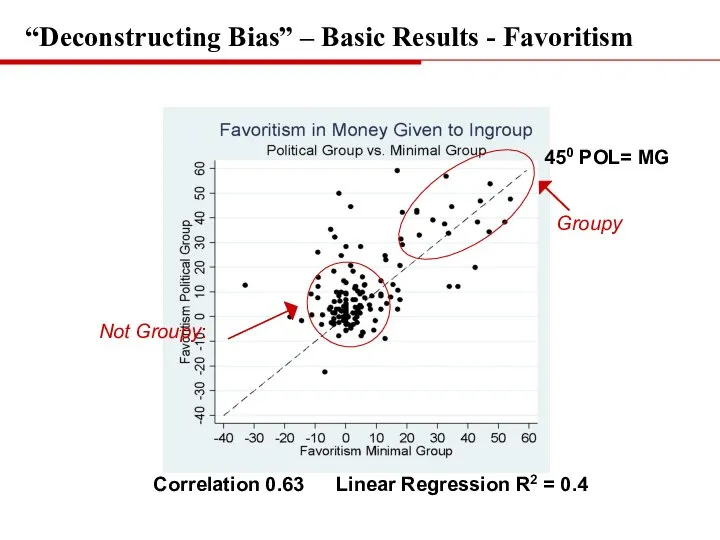
- 47. Correlation coefficient: 0.63 Regression R2 = 0.40 450 POL= MG Groupy Not Groupy: Correlation 0.63 Linear
- 48. Ui(πi, πj) = βiπi + ρi(πi − πj)r + σi(πj − πi)s βi weight on own
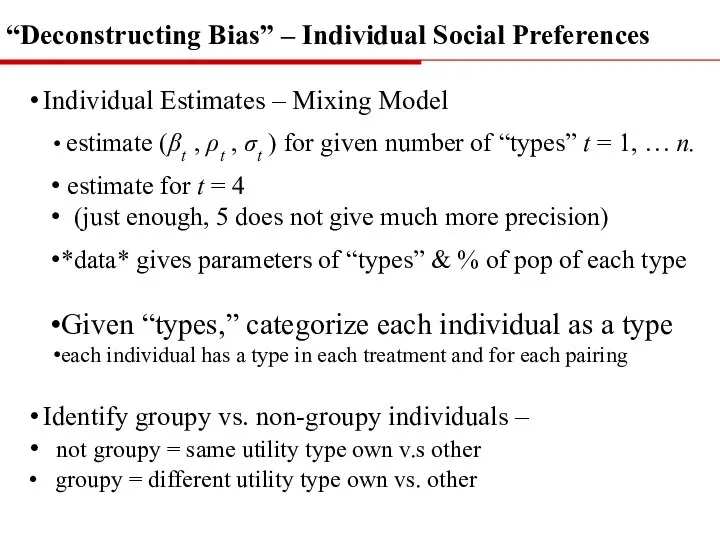
- 49. Individual Estimates – Mixing Model estimate (βt , ρt , σt ) for given number of
- 50. Diagonal = non-groupy – same preferences toward in and outgroup Off – diagonal = groupy –
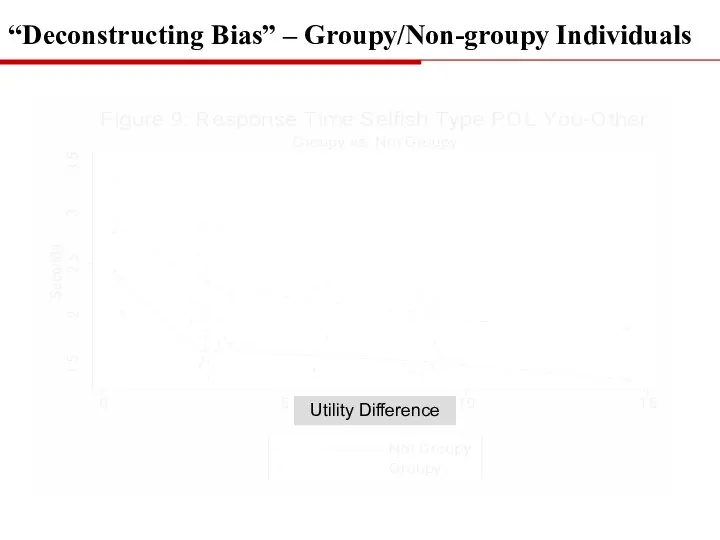
- 51. Utility Difference “Deconstructing Bias” – Groupy/Non-groupy Individuals
- 52. “Deconstructing Bias” – Groupy/Non-groupy Correlates
- 53. Groupiness correlated “real-world” behavior/demog Political affiliation In the main study and in follow up M-Turk study
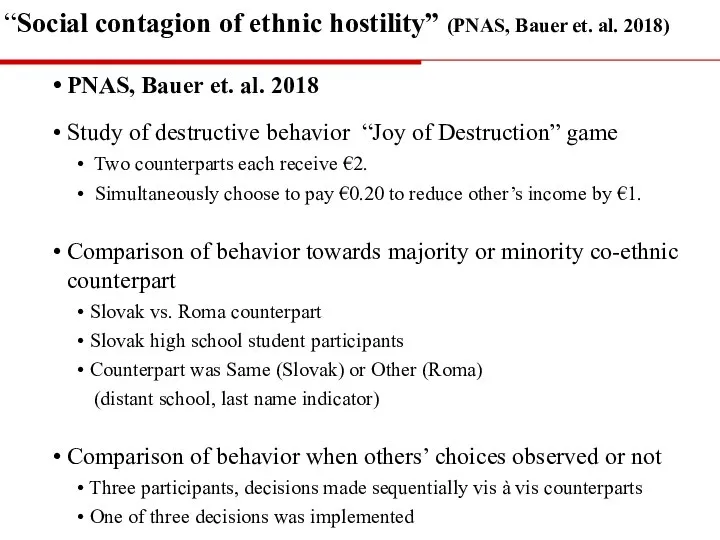
- 54. “Social contagion of ethnic hostility” (PNAS, Bauer et. al. 2018) PNAS, Bauer et. al. 2018 Study
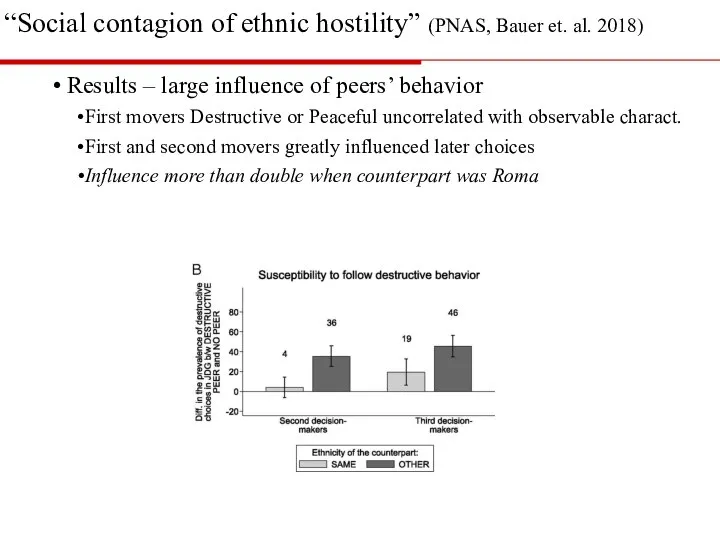
- 55. Results – large influence of peers’ behavior First movers Destructive or Peaceful uncorrelated with observable charact.
- 56. Empirical work on identity What “identity effects” can we observe in data? With emphasis on inequality…..
- 57. “Gender Identity and Relative Income within Households” Bertrand, Kamenica & Pan (2013) Gender norms in US
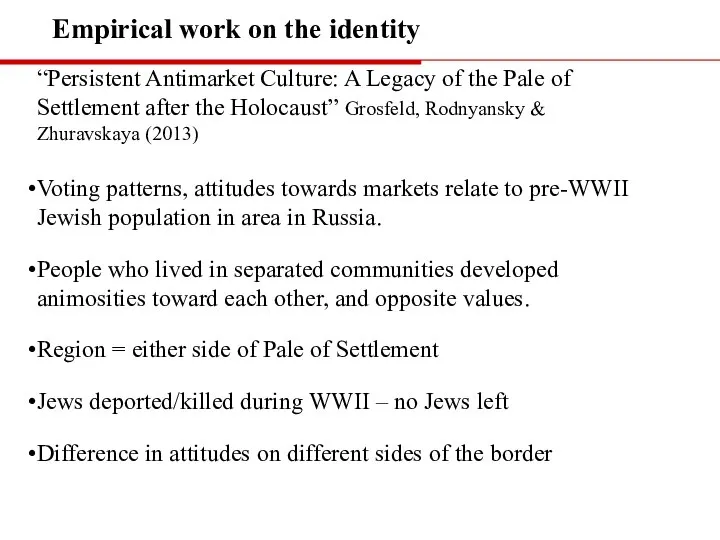
- 58. “Persistent Antimarket Culture: A Legacy of the Pale of Settlement after the Holocaust” Grosfeld, Rodnyansky &
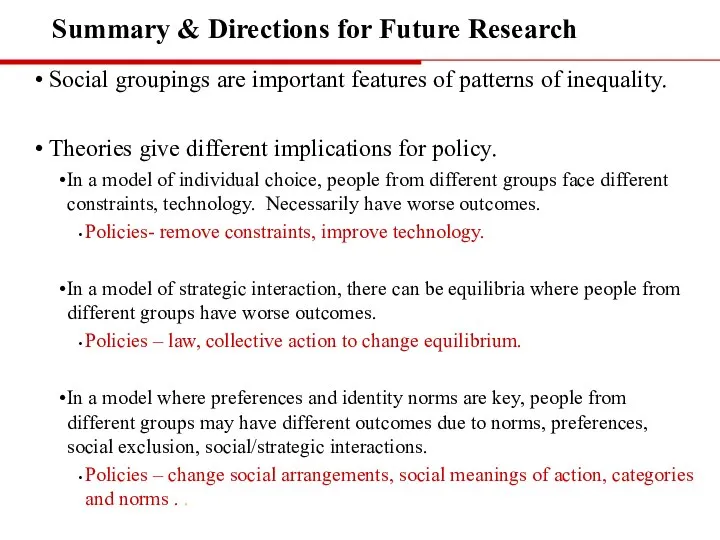
- 59. Summary & Directions for Future Research Social groupings are important features of patterns of inequality. Theories
- 61. Скачать презентацию
Слайд 3Introduction – Social Categories
Identity –
At a minimum a designator of a
Introduction – Social Categories
Identity –
At a minimum a designator of a
Слайд 4Introduction – Preferences & “Identity”
What is “identity?”
A person’s sense of self; a
Introduction – Preferences & “Identity”
What is “identity?”
A person’s sense of self; a
Слайд 5Introduction - “Identity”
Identity-contingent utility/payoff function.
Individuals have preferences over own and others’ actions,
Introduction - “Identity”
Identity-contingent utility/payoff function.
Individuals have preferences over own and others’ actions,
Слайд 6Introduction - “Identity”
Why do we want a model with identity?
Add identity
Introduction - “Identity”
Why do we want a model with identity?
Add identity
Слайд 7Outline of Lecture
Identity & Inequality – Part 1 – Theory
Overview theoretical
Outline of Lecture
Identity & Inequality – Part 1 – Theory
Overview theoretical
Слайд 8Identity and Inequality
Part 1
Economic Theory
Rachel E. Kranton
HCEO Summer School
2021
Identity and Inequality
Part 1
Economic Theory
Rachel E. Kranton
HCEO Summer School
2021
Слайд 9Introduction – Why theory?
Putting identity/social category markers is standard practice in empirical
Introduction – Why theory?
Putting identity/social category markers is standard practice in empirical
Слайд 10General Overview of Theoretical Approaches
Basic Economic Model
Individuals have utility from
General Overview of Theoretical Approaches
Basic Economic Model
Individuals have utility from
Слайд 11General Overview: Basic Economic Model
Utility Function: individual w/exogenous, idiosyncratic preferences
Makes choice given
General Overview: Basic Economic Model
Utility Function: individual w/exogenous, idiosyncratic preferences
Makes choice given
Слайд 12General Overview: Strategic Interaction
Strategic Interaction:
Individual payoffs depend on own preferences and others’
General Overview: Strategic Interaction
Strategic Interaction:
Individual payoffs depend on own preferences and others’
Слайд 13General Overview: Strategic Interaction
Inequality is the capricious outcome of strategic interaction
General Overview: Strategic Interaction
Inequality is the capricious outcome of strategic interaction
Слайд 14General Overview – Preferences and “Identity”
Preferences and norms are a possible
General Overview – Preferences and “Identity”
Preferences and norms are a possible
Слайд 15Akerlof & Kranton – Identity & Preferences (Norms)
Build a model where individuals
Akerlof & Kranton – Identity & Preferences (Norms)
Build a model where individuals
Слайд 16Identity – General Framework
Start with a standard model of utility.
The utility of
Identity – General Framework
Start with a standard model of utility.
The utility of
Слайд 17Identity - General Framework: Utility & Identity
Add identity ingredients
Set of Social Categories:
Identity - General Framework: Utility & Identity
Add identity ingredients
Set of Social Categories:
Слайд 18Identity - General Framework: Utility & Identity
Uj = Uj (aj, a-j, Ij)
Identity - General Framework: Utility & Identity
Uj = Uj (aj, a-j, Ij)
Слайд 19Example of Identity Model – Education & Schooling
Akerlof & Kranton (2002)
Basic model
Example of Identity Model – Education & Schooling
Akerlof & Kranton (2002)
Basic model
Слайд 20Large population of individuals
Each individual exogenously given ni = “ability”
Marketable
Large population of individuals
Each individual exogenously given ni = “ability”
Marketable
Слайд 21Individual’s overall utility:
Ui (ei , C; εi, Norms) =
ni
Individual’s overall utility:
Ui (ei , C; εi, Norms) =
ni
Слайд 22Individuals choose (simultaneously) effort and category.
Balance payoffs from effort in school, “fitting
Balance payoffs from effort in school, “fitting
Слайд 23School policy to affect achievement through social arrangements
Introduce athletics, and social category
Introduce athletics, and social category
Слайд 24Consider a population with different ethnic, social groups.
Curriculum thought to favor one
Consider a population with different ethnic, social groups.
Curriculum thought to favor one
Слайд 25•
fasdfkljas;fljk;lasjflaksjfdajfkasjhdfklasjfklsdjfkljsklfjklsfjklsdjfklsdjfklajjdsfljkaklfslfjadjf;kaljflasjflk
Example of Identity Model – Redistribution
Shayo (2009)
•
fasdfkljas;fljk;lasjflaksjfdajfkasjhdfklasjfklsdjfkljsklfjklsfjklsdjfklsdjfklajjdsfljkaklfslfjadjf;kaljflasjflk
Example of Identity Model – Redistribution
Shayo (2009)
Слайд 26Add identity considerations – groups and utility
Set of groups, each group J
Add identity considerations – groups and utility
Set of groups, each group J
Слайд 27
•
Example of Identity Model – Redistribution
Shayo (2009)
•
Example of Identity Model – Redistribution
Shayo (2009)
Слайд 28Social Identity Equilibrium = actions and identities for each agent and outcome
Social Identity Equilibrium = actions and identities for each agent and outcome
Слайд 29Identity and Inequality
Part 2
Economic Experiments
Rachel E. Kranton
HCEO Summer School
2021
Identity and Inequality
Part 2
Economic Experiments
Rachel E. Kranton
HCEO Summer School
2021
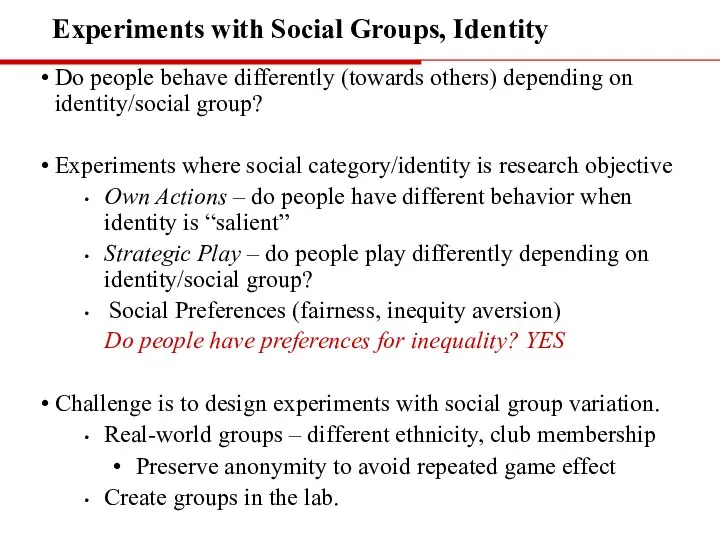
Слайд 30Experiments with Social Groups, Identity
Do people behave differently (towards others) depending on
Experiments with Social Groups, Identity
Do people behave differently (towards others) depending on
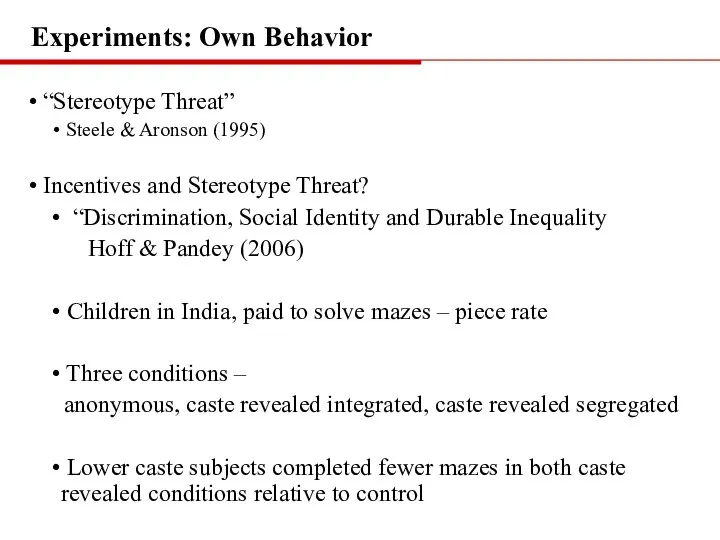
Слайд 31Experiments: Own Behavior
“Stereotype Threat”
Steele & Aronson (1995)
Incentives and Stereotype Threat?
Experiments: Own Behavior
“Stereotype Threat”
Steele & Aronson (1995)
Incentives and Stereotype Threat?
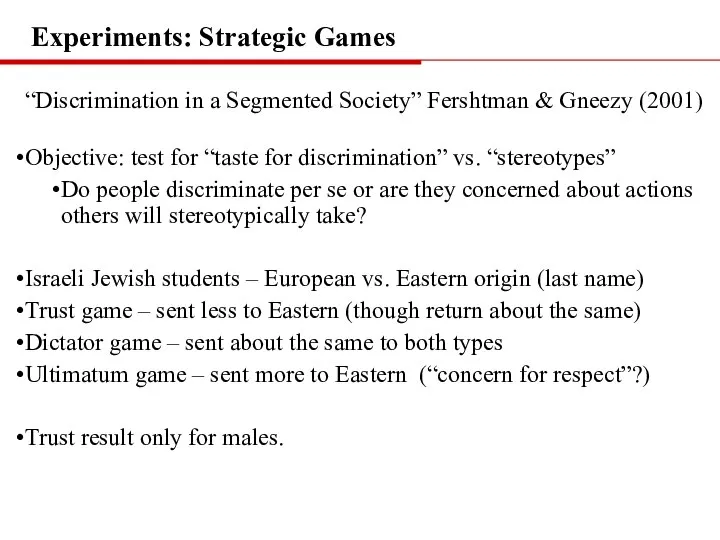
Слайд 32Experiments: Strategic Games
“Discrimination in a Segmented Society” Fershtman & Gneezy (2001)
Objective: test
Experiments: Strategic Games
“Discrimination in a Segmented Society” Fershtman & Gneezy (2001)
Objective: test
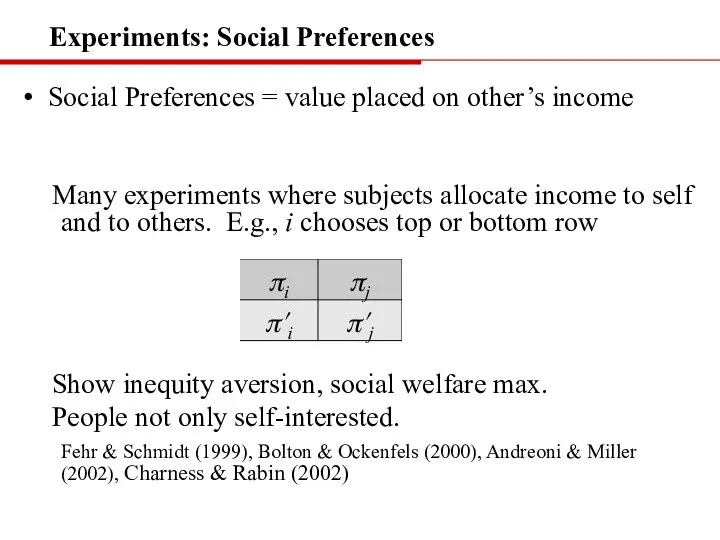
Слайд 33Experiments: Social Preferences
Social Preferences = value placed on other’s income
Many experiments
Experiments: Social Preferences
Social Preferences = value placed on other’s income
Many experiments
Слайд 34Reality Check on Social Preference Experiments
Group conflict feature of human history
Groups
Reality Check on Social Preference Experiments
Group conflict feature of human history
Groups
Слайд 35Experiments: Group Conflict, Identity, Social Prefer
Social Psychology Experiments (1950’s –
Experiments: Group Conflict, Identity, Social Prefer
Social Psychology Experiments (1950’s –
Слайд 36Social Preferences Estimation
Ui(πi, πj) = βiπi + ρi(πi − πj)r
Social Preferences Estimation
Ui(πi, πj) = βiπi + ρi(πi − πj)r
Слайд 37But what about ubiquitous group conflict??
Group conflict feature of human history
Groups
But what about ubiquitous group conflict??
Group conflict feature of human history
Groups
Слайд 38“Deconstructing bias in social preferences reveals groupy and not-groupy behavior”
Rachel Kranton, Matthew
“Deconstructing bias in social preferences reveals groupy and not-groupy behavior”
Rachel Kranton, Matthew
Слайд 39“Deconstructing Bias” – Introduction
Maybe stronger identification with group ?
Do people
“Deconstructing Bias” – Introduction
Maybe stronger identification with group ?
Do people
Слайд 40
Two conditions: minimal group, political group – w/i subject
Individuals: more or
Two conditions: minimal group, political group – w/i subject
Individuals: more or
Слайд 41Duke University subject pool - no deception lab
Schematic of experimental session:
Paid for
Schematic of experimental session:
Paid for
Слайд 42Political Group: participants self-identified as
Democrat Republican Independent None of the Above
closer
Political Group: participants self-identified as
Democrat Republican Independent None of the Above
closer
Слайд 43Allocation choices, timed as follows:
26 matrices, 26x7 = 208 decisions per subject
Top,
Allocation choices, timed as follows:
26 matrices, 26x7 = 208 decisions per subject
Top,
Слайд 44Choose Bottom = Dominance-Seeking/Inequity Loving
Choose Bottom = Dominance-Seeking/Inequity Loving
Слайд 45 Consider individual “favoritism” in allocating income
For an individual i
Consider individual “favoritism” in allocating income
For an individual i
Слайд 46
yes
Favoritism towards Ingroup
Political Group
Favoritism towards Ingroup
Minimal Group
D-Indep
Democrats
Democrats
yes
Favoritism towards Ingroup
Political Group
Favoritism towards Ingroup
Minimal Group
D-Indep
Democrats
Democrats
Слайд 47
Correlation coefficient: 0.63
Regression R2 = 0.40
450 POL= MG
Groupy
Not Groupy:
Correlation 0.63
Linear Regression
Correlation coefficient: 0.63
Regression R2 = 0.40
450 POL= MG
Groupy
Not Groupy:
Correlation 0.63
Linear Regression
Слайд 48 Ui(πi, πj) = βiπi + ρi(πi − πj)r + σi(πj −
Ui(πi, πj) = βiπi + ρi(πi − πj)r + σi(πj −
Слайд 49Individual Estimates – Mixing Model
estimate (βt , ρt , σt )
Individual Estimates – Mixing Model
estimate (βt , ρt , σt )
Слайд 50
Diagonal = non-groupy – same preferences toward in and outgroup
Off – diagonal
Diagonal = non-groupy – same preferences toward in and outgroup
Off – diagonal
Слайд 51Utility Difference
“Deconstructing Bias” – Groupy/Non-groupy Individuals
Utility Difference
“Deconstructing Bias” – Groupy/Non-groupy Individuals
Слайд 52“Deconstructing Bias” – Groupy/Non-groupy Correlates
“Deconstructing Bias” – Groupy/Non-groupy Correlates
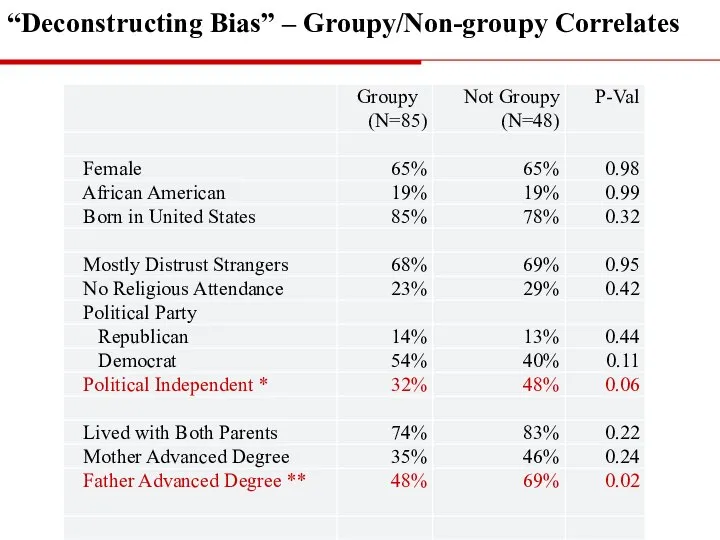
Слайд 53Groupiness correlated “real-world” behavior/demog
Political affiliation
In the main study and in follow up
Political affiliation
In the main study and in follow up
Слайд 54“Social contagion of ethnic hostility” (PNAS, Bauer et. al. 2018)
PNAS, Bauer et.
“Social contagion of ethnic hostility” (PNAS, Bauer et. al. 2018)
PNAS, Bauer et.
Слайд 55Results – large influence of peers’ behavior
First movers Destructive or Peaceful uncorrelated
Results – large influence of peers’ behavior
First movers Destructive or Peaceful uncorrelated
Слайд 56Empirical work on identity
What “identity effects” can we observe in data?
Empirical work on identity
What “identity effects” can we observe in data?
Слайд 57“Gender Identity and Relative Income within Households”
Bertrand, Kamenica & Pan (2013)
“Gender Identity and Relative Income within Households”
Bertrand, Kamenica & Pan (2013)
Слайд 58“Persistent Antimarket Culture: A Legacy of the Pale of Settlement after the
“Persistent Antimarket Culture: A Legacy of the Pale of Settlement after the
Слайд 59Summary & Directions for Future Research
Social groupings are important features of patterns
Summary & Directions for Future Research
Social groupings are important features of patterns
 Соглашение о межрегиональном сотрудничестве в экономической области между Калининградской областью и Гамбургом
 Глобальные проблемы человечества
 Общая характеристика направления подготовки 38.03.01 Экономика
 Цена
Цена Механизм ценообразования. Законы спроса и предложения. Тест
 Rossia_v_mire_Schitova_Fokina
 Спрос и предложение
 Подборка фразеологизмов и пословиц по экономическому воспитанию дошкольников
 Экономика труда. Лекция 1
 Экономический рост. Экономические циклы
 Стресс, как фактор затруднения коммуникации
 econom
 Экономический рост и развитие
 Экономика и общественная среда: взаимосвязь и взаимовлияние
 Кадровая, интеллектуальная безопасность в системе экономической безопасности организации
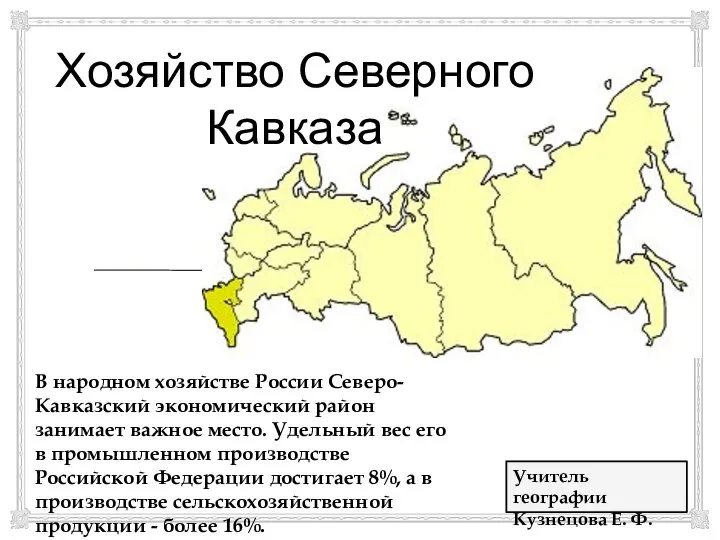 Хозяйство Северного Кавказа
 Виробництво транспортних засобів та електроніки, фармацевтичної продукції, текстилю, одягу, взуття. Надання послуг
 Анализ рынка рыбоконсервных комбинатов в Калининградской области
 Методы определения отраслей специализации региона
 Государственное регулирование хозяйства. Лекции 10
 Лидерство в 21 веке
 Рынок: спрос, предложение, равновесие
 Основные фонды предприятия
 Государство и экономика. Задания для выполнения
 Актуализация перечня энергоэффективных объектов и технологий. Исходные условия, основные подходы и положения
 Теория общественного выбора
 Проект. Фирма по производству махровых и вафельных полотенец. Описание предприятия. Фирма ПАО Ящерица
 Финансовая политика